Traditional Worksheets
This traditional worksheet section provides 6th grade students with focused practice on statistical concepts including mean, median, mode, and range. Students work through individual skill-building exercises and comprehensive problem sets that examine complete data sets in both numeric and word problem formats.
Filter By Grade
Problem Type


About these worksheets
Students practice finding key measures of central tendency and spread for data sets. Worksheets cover calculating the mean, median, mode, and range individually and in combined problem sets, including word problem formats. These resources build the statistical thinking skills needed for sixth grade and beyond.
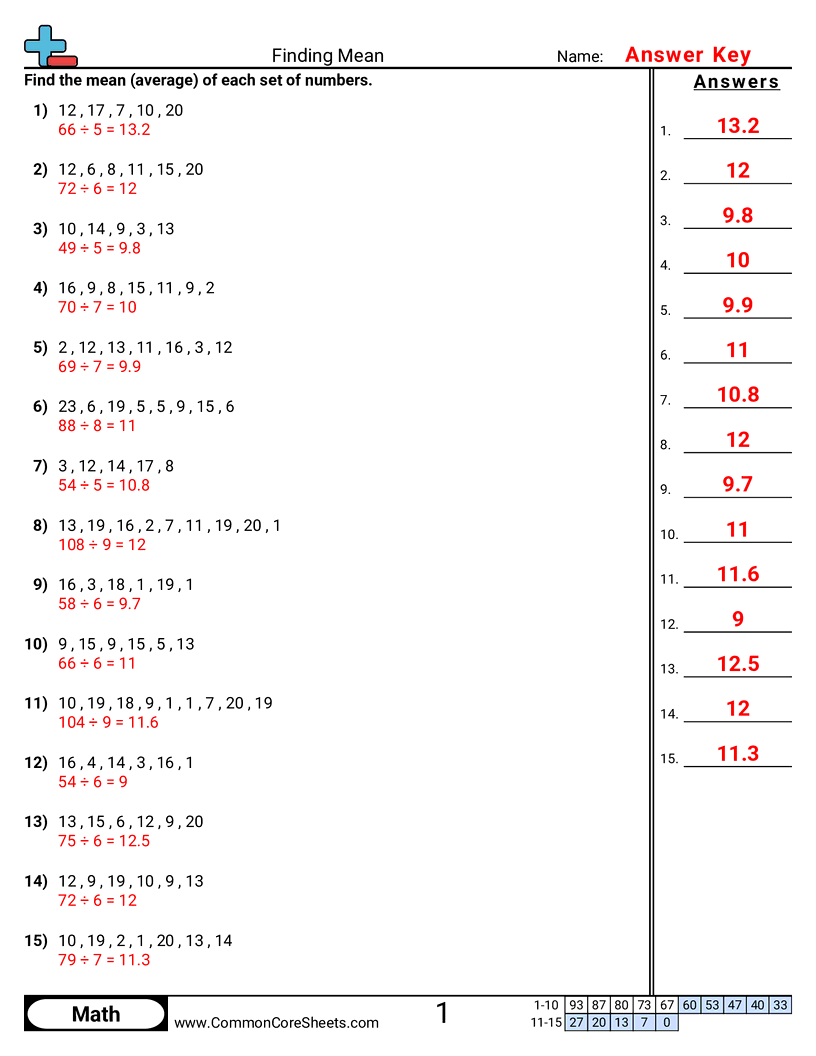


Each worksheet has 15 problems finding the mean of a set of numbers.


Version 1
Version 2
Version 3
Version 4
Version 5
Version 6
Version 7
Version 8
Version 9
Version 10
Grab 'em All
Create New Sheet
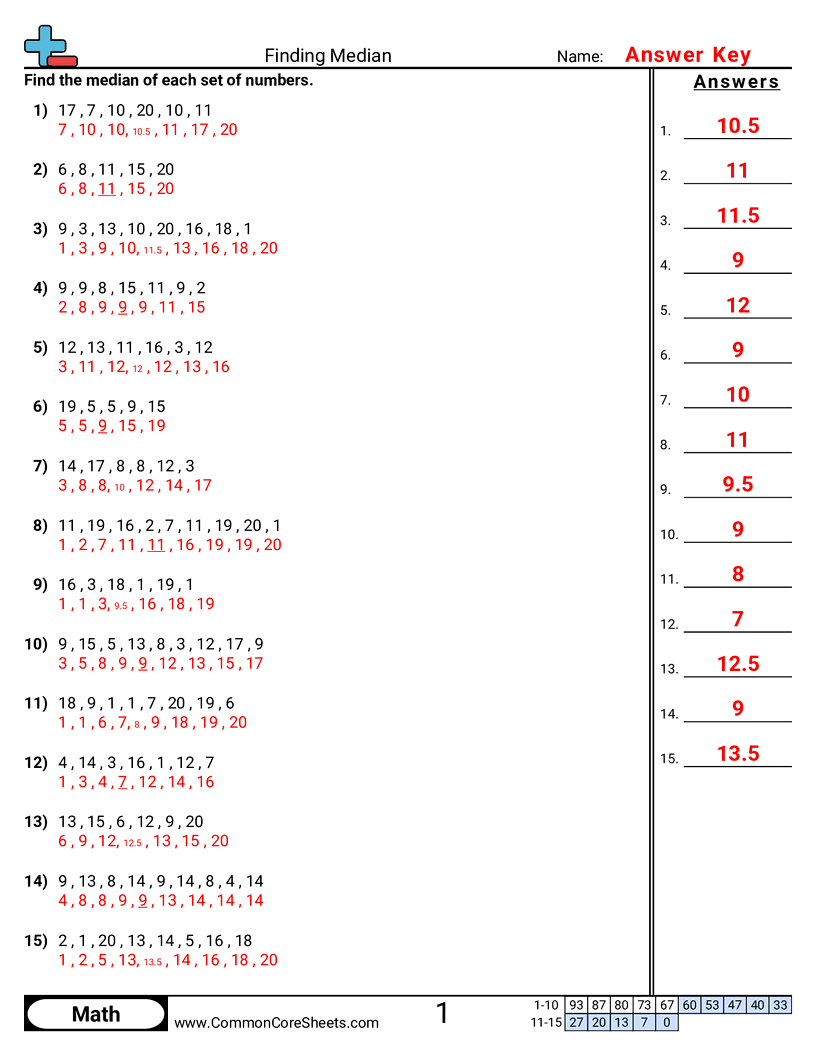
Each worksheet has 15 problems finding the median of a set of numbers.
Version 1
Version 2
Version 3
Version 4
Version 5
Version 6
Version 7
Version 8
Version 9
Version 10
Grab 'em All
Create New Sheet
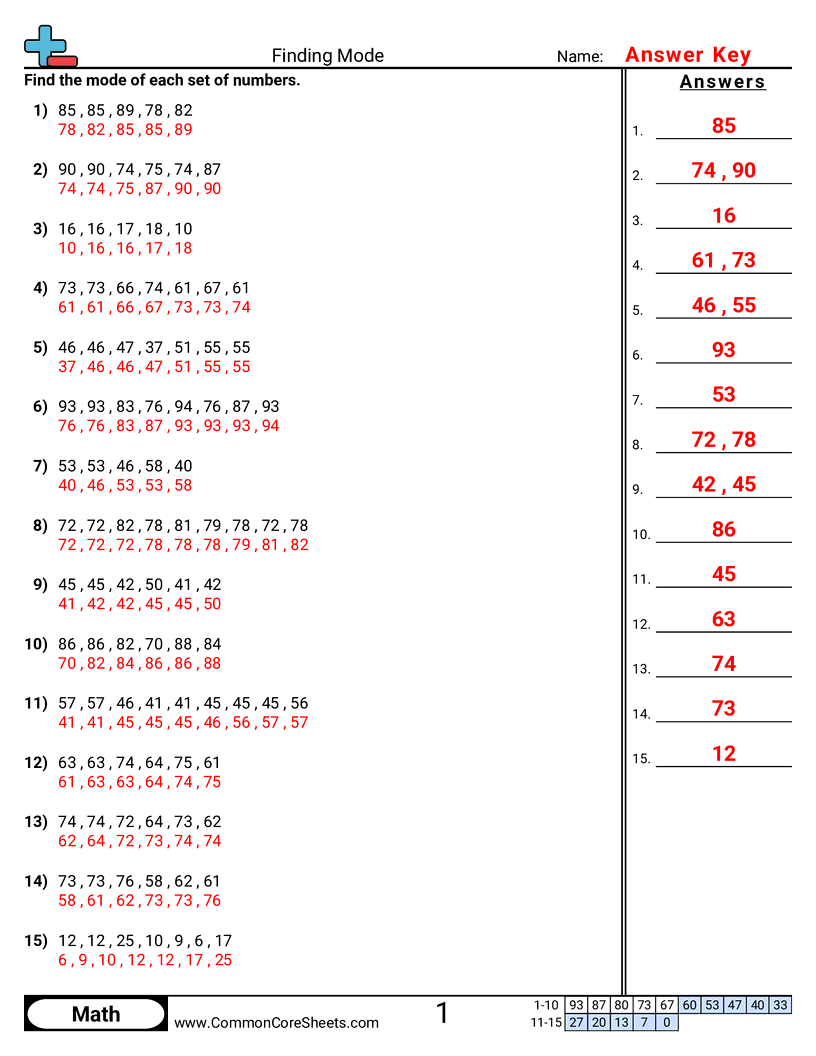
Each worksheet has 15 problems finding the mode of a set of numbers.
Version 1
Version 2
Version 3
Version 4
Version 5
Version 6
Version 7
Version 8
Version 9
Version 10
Grab 'em All
Create New Sheet
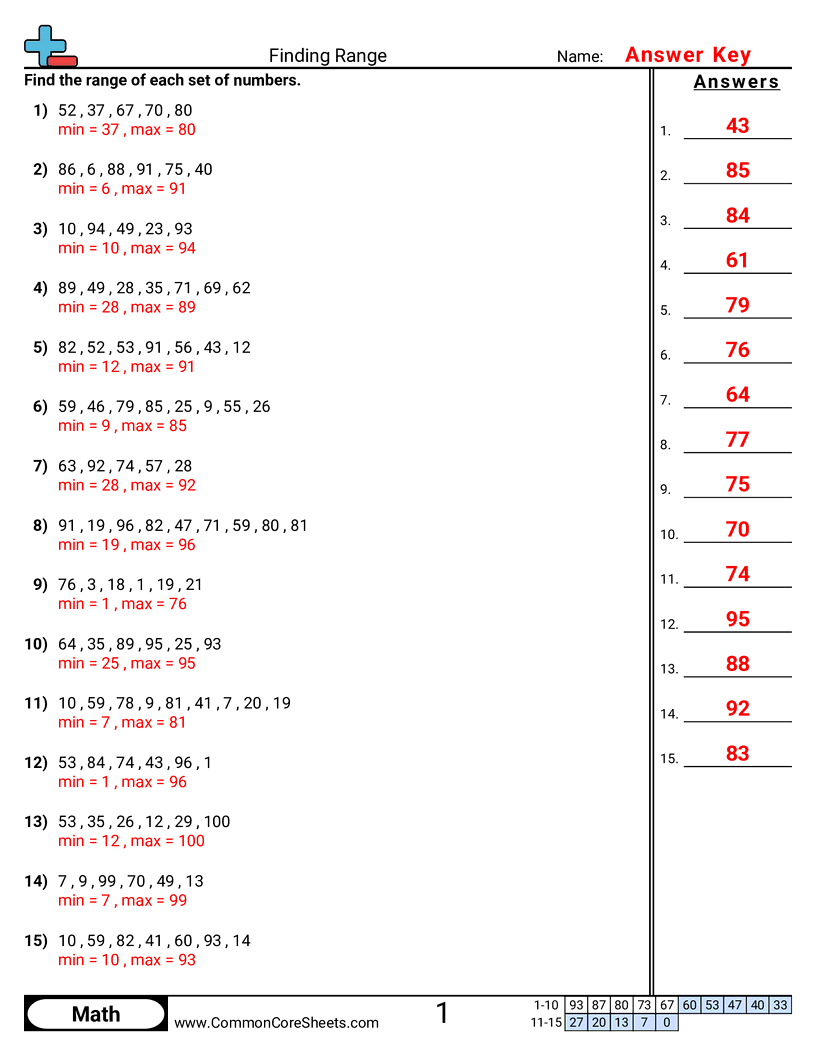
Each worksheet has 15 problems finding the range of a set of numbers.
Version 1
Version 2
Version 3
Version 4
Version 5
Version 6
Version 7
Version 8
Version 9
Version 10
Grab 'em All
Create New Sheet
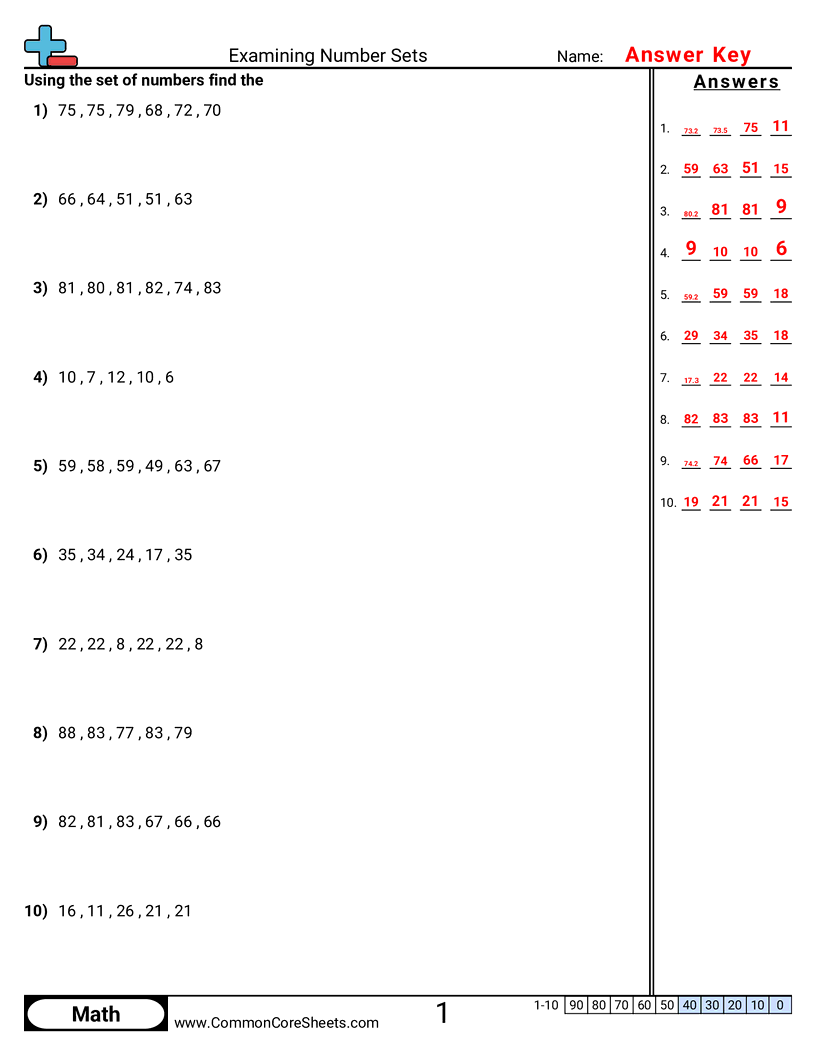
Each worksheet has 10 problems finding the mean, median, mode and range of a set of numbers.
Version 1
Version 2
Version 3
Version 4
Version 5
Version 6
Version 7
Version 8
Version 9
Version 10
Grab 'em All
Create New Sheet
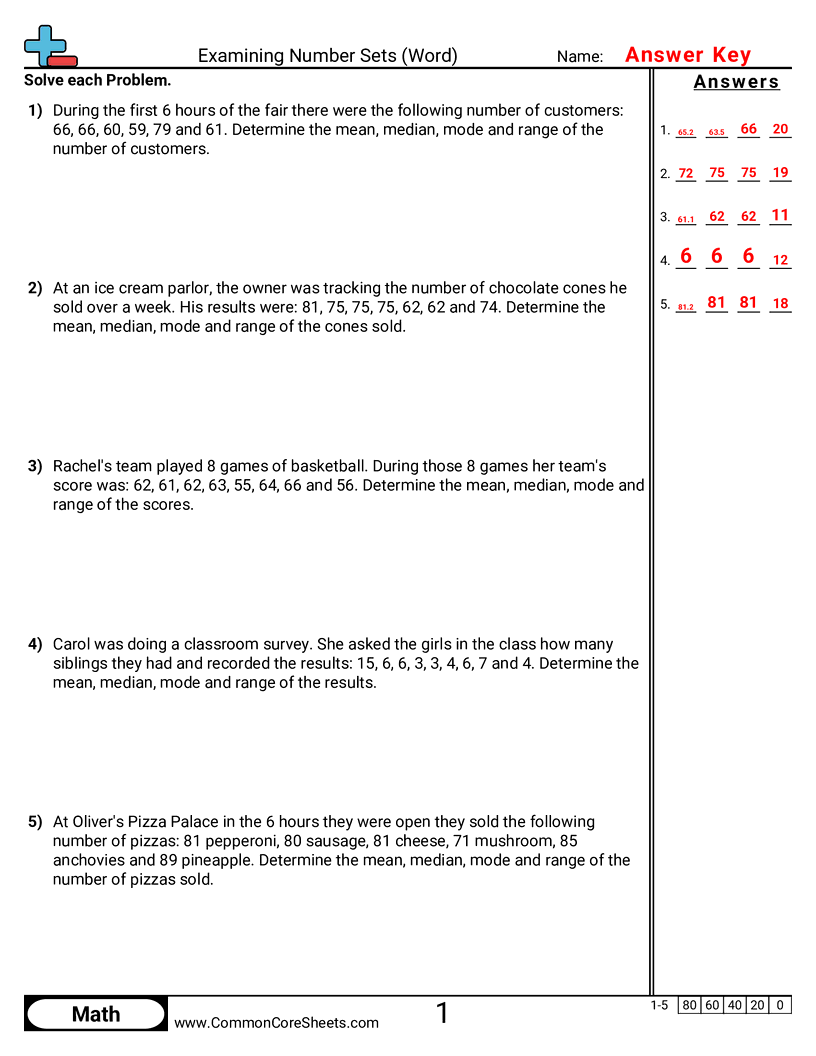
Each worksheet has 5 problems examining data sets in word problem form.
Version 1
Version 2
Version 3
Version 4
Version 5
Version 6
Version 7
Version 8
Version 9
Version 10
Grab 'em All
Create New Sheet
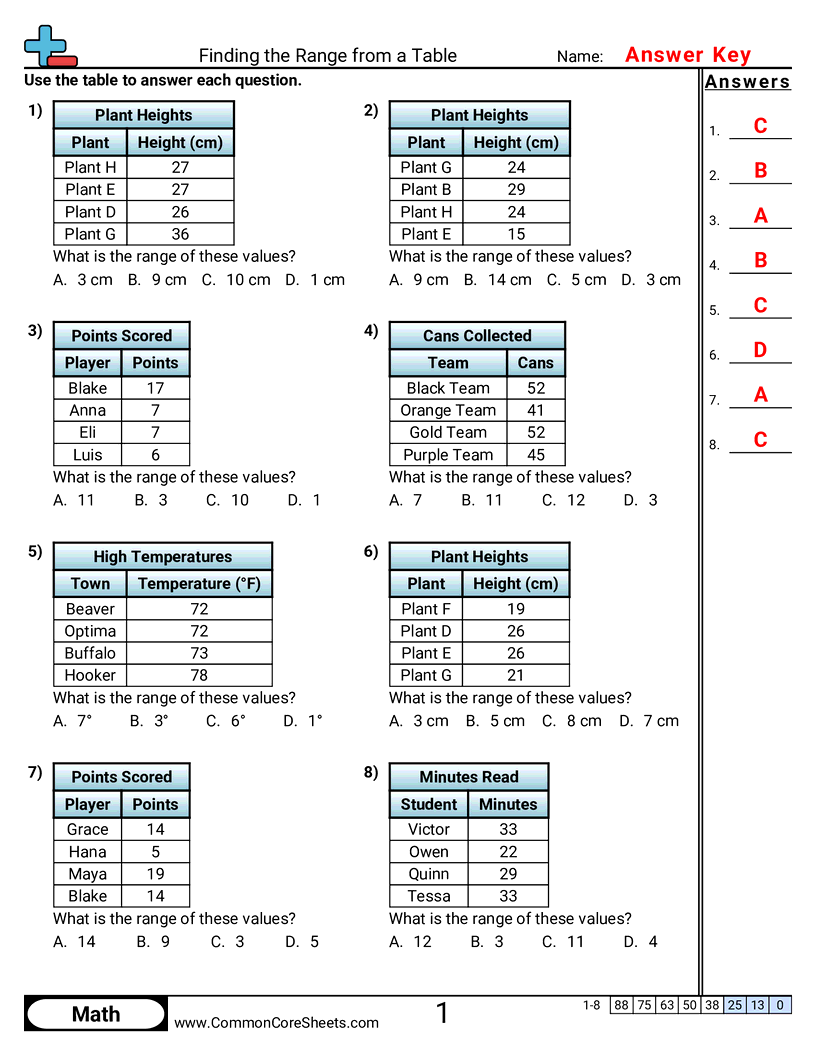
Students read a set of values from a table and find the range by subtracting the smallest number from the largest.
Version 1
Version 2
Version 3
Version 4
Version 5
Version 6
Version 7
Version 8
Version 9
Version 10
Grab 'em All
Create New Sheet
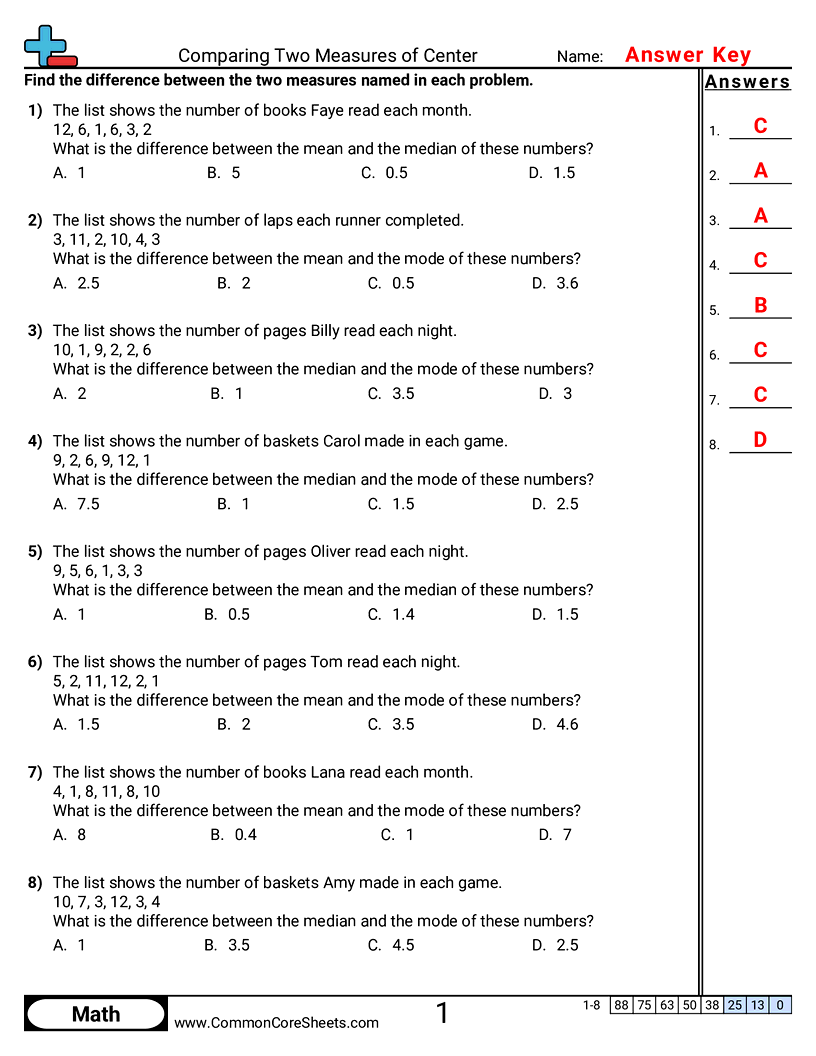
Each worksheet has 8 problems finding the difference between two named measures of center for a small data set.
Version 1
Version 2
Version 3
Version 4
Version 5
Version 6
Version 7
Version 8
Version 9
Version 10
Grab 'em All
Create New Sheet
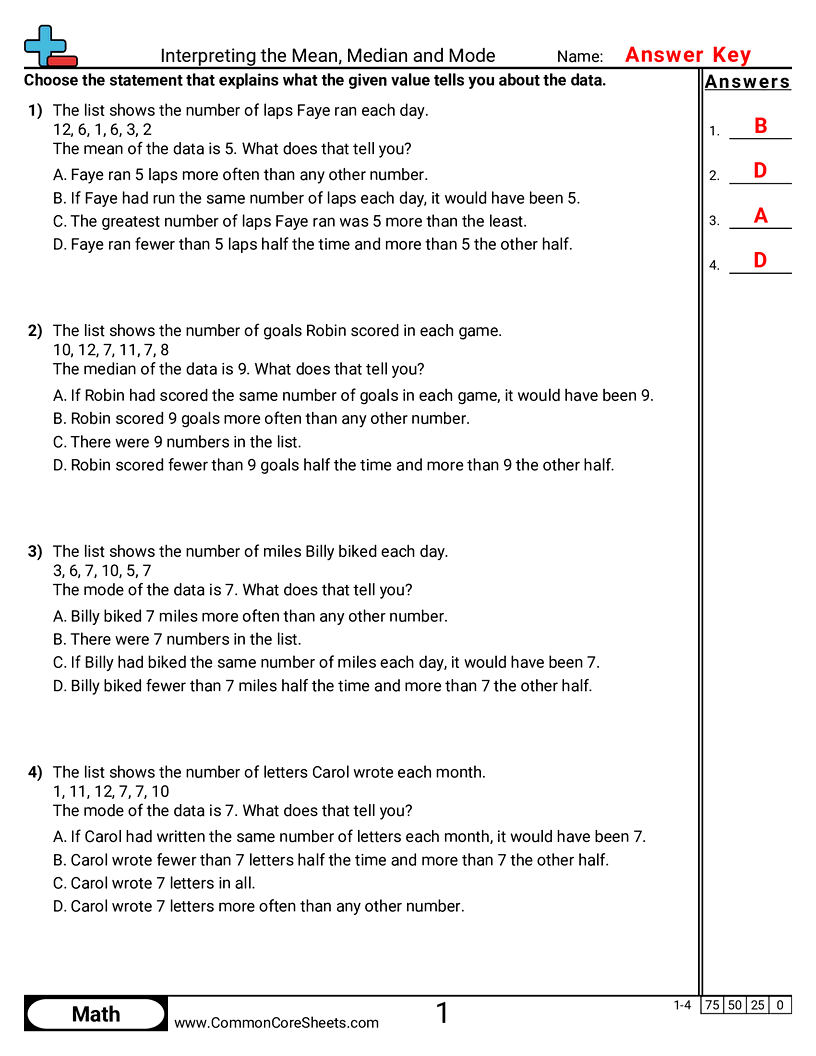
Each worksheet has 4 problems choosing the statement that explains what a given measure of center tells you about the data.
Version 1
Version 2
Version 3
Version 4
Version 5
Version 6
Version 7
Version 8
Version 9
Version 10
Grab 'em All
Create New Sheet
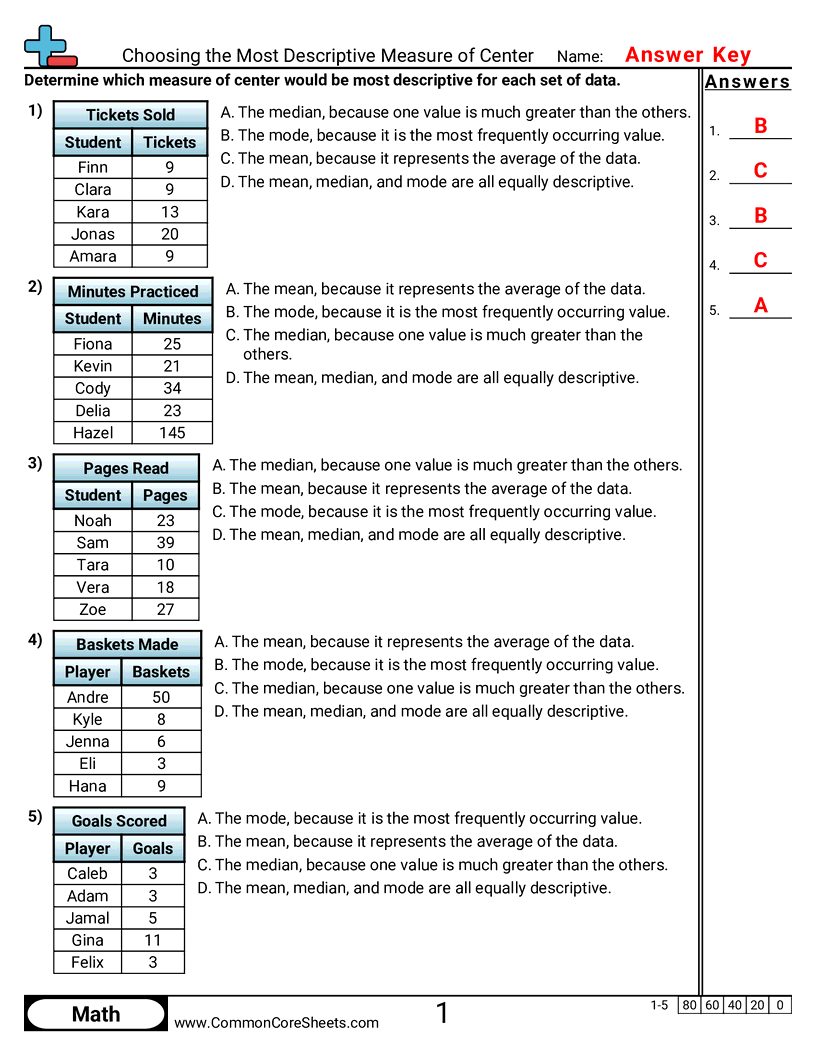
Students read a data table and decide which measure of center best describes it - the mean, the median, the mode, or all three equally - with the reason built into each answer choice.
Version 1
Version 2
Version 3
Version 4
Version 5
Version 6
Version 7
Version 8
Version 9
Version 10
Grab 'em All
Create New Sheet
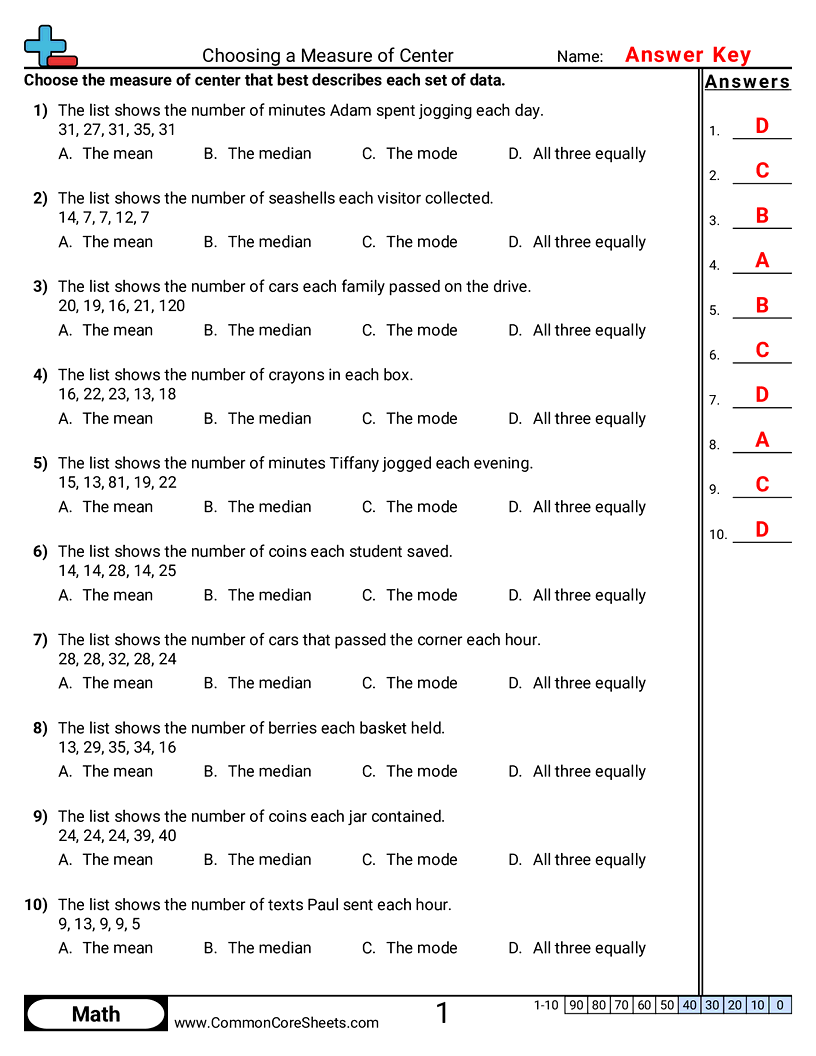
Each worksheet has 10 problems choosing whether the mean, the median, the mode, or all three best describe a set of data.
Version 1
Version 2
Version 3
Version 4
Version 5
Version 6
Version 7
Version 8
Version 9
Version 10
Grab 'em All
Create New Sheet
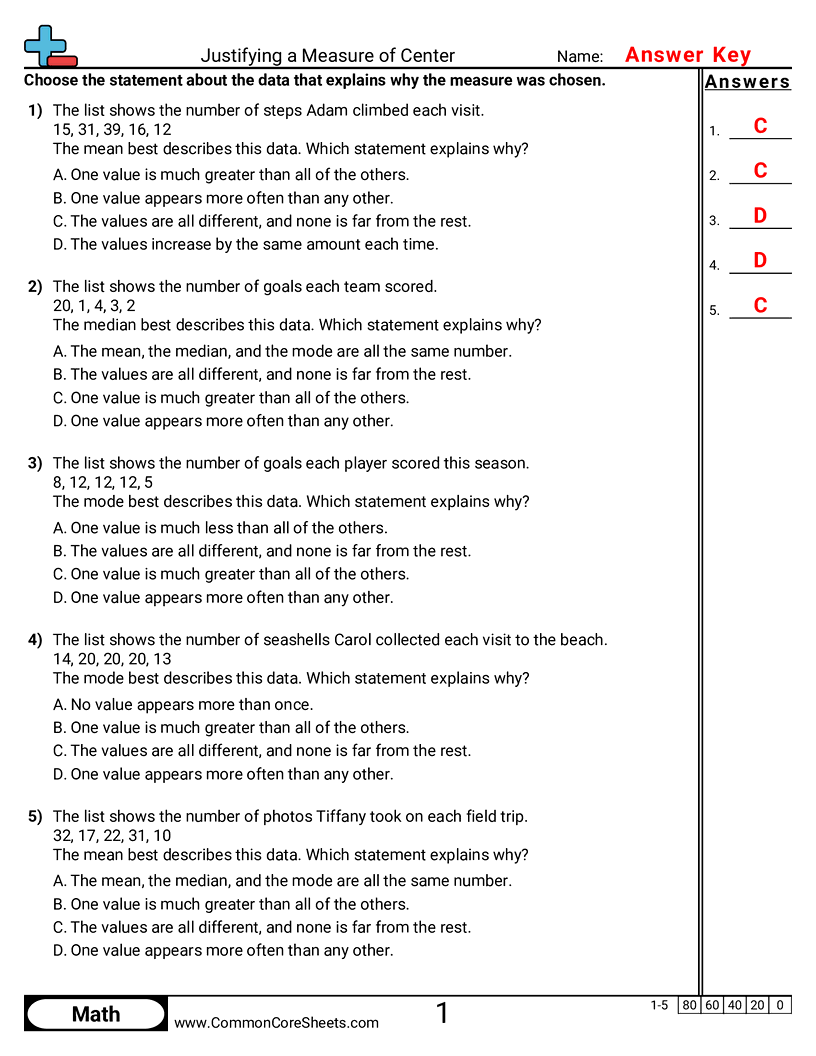
Each worksheet has 5 problems choosing the statement about the data that explains why a measure of center was chosen.
Version 1
Version 2
Version 3
Version 4
Version 5
Version 6
Version 7
Version 8
Version 9
Version 10
Grab 'em All
Create New Sheet
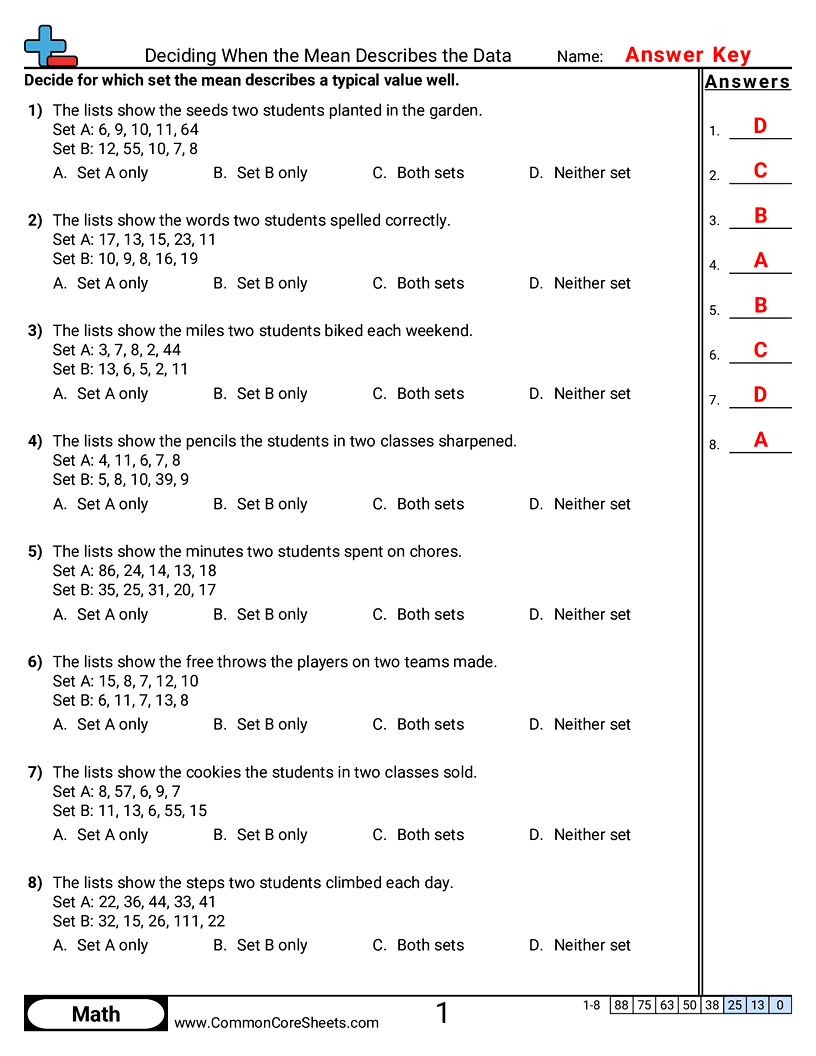
Each worksheet has 8 problems comparing two sets of data and deciding for which of them the mean describes a typical value well.
Version 1
Version 2
Version 3
Version 4
Version 5
Version 6
Version 7
Version 8
Version 9
Version 10
Grab 'em All
Create New Sheet