Choosing the Most Descriptive Measure of Center Worksheet Download
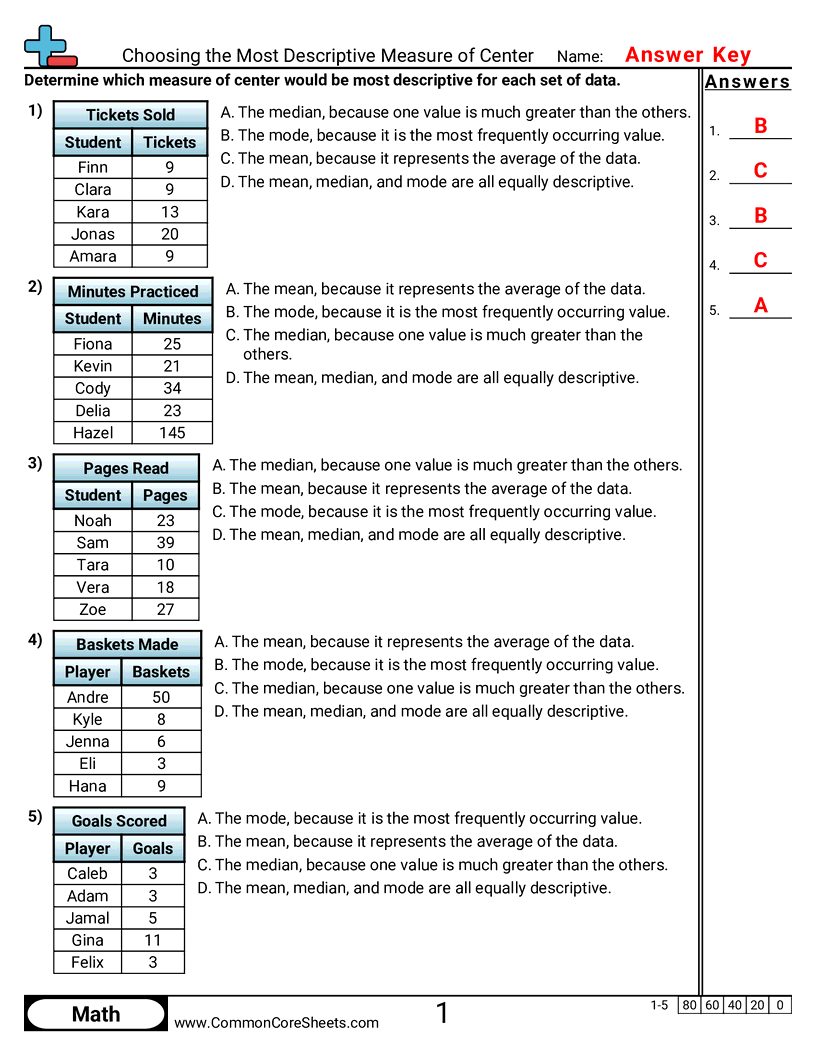
This 6th grade worksheet has students decide which measure of center best describes each set of data. Where other sheets ask students to calculate the mean, median and mode, this one asks which of them to trust: one set has an outlier that drags the mean away from the data, one repeats a single value across most of its rows, one is evenly spread with nothing repeated, and one is symmetric enough that all three measures come out to the same number.


Sheet Information >
Choosing the Most Descriptive Measure of Center
Students read a data table and decide which measure of center best describes it - the mean, the median, the mode, or all three equally - with the reason built into each answer choice.
About this worksheet
Students read a data table and decide which measure of center best describes it - the mean, the median, the mode, or all three equally - with the reason built into each answer choice.
Student objectives
- Decide which measure of center best represents a set of data
- Recognize when an outlier makes the median a better choice than the mean
- Recognize when a repeated value makes the mode the most descriptive measure
- Recognize when a symmetric set makes the mean, median and mode equally descriptive
Everyday practice
- Deciding the 'typical' price of items when a few are much more expensive than the rest
- Figuring out a fair average score when one game or test result is way off
- Describing the usual amount of allowance friends get when one gets a lot more
- Explaining a typical daily temperature for the week when one day was unusually hot or cold