Deciding When the Mean Describes the Data Worksheet Download
Free 6th Grade math worksheets on Deciding When the Mean Describes the Data. Each worksheet has 8 problems with an answer key and are ideal for teachers and homeschooling. You can download the PDF, create a set of flash cards or set it up for online learning.


Sheet Information >
About this worksheet
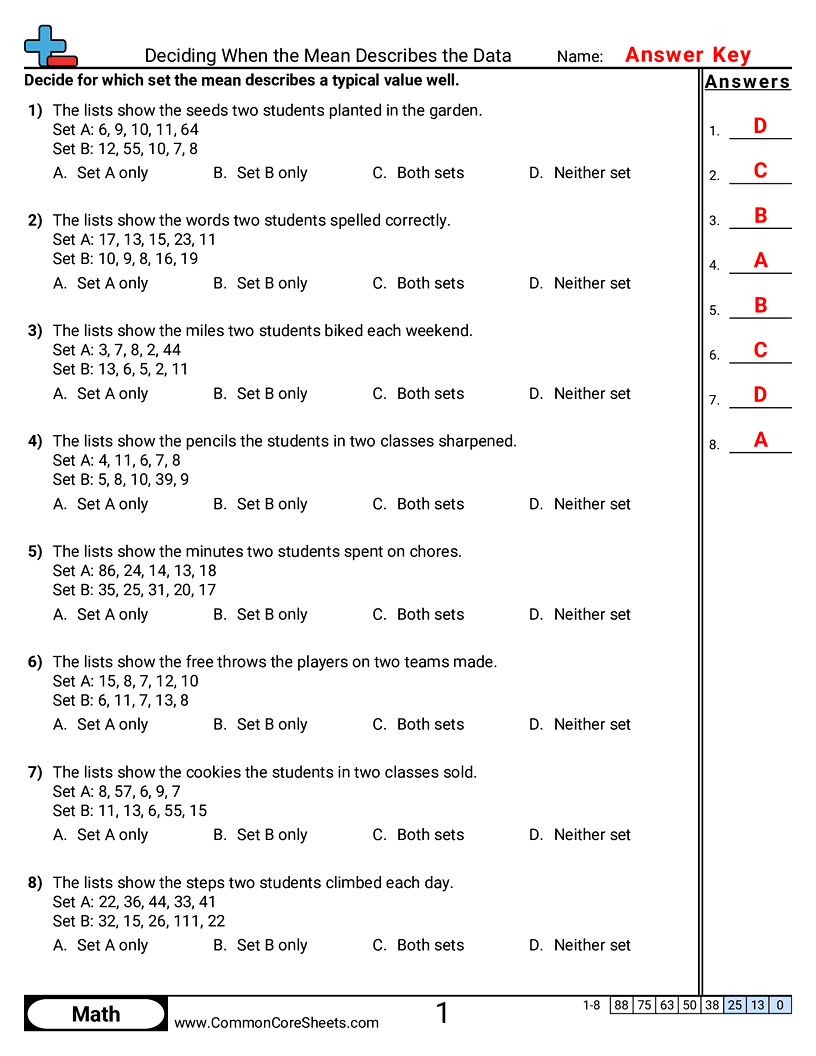
Each worksheet has 8 problems comparing two sets of data and deciding for which of them the mean describes a typical value well.
Every other worksheet on choosing a measure of center shows one set of data, and a student can answer them all with a rule of thumb without ever having an opinion about what a distribution looks like. Putting two sets side by side and asking which of them the mean survives makes the shape of the data the subject. The two kinds of set used are the only two the question can be marked on - values spread evenly with none far from the rest, or one value that drags the average clear of every other number on the page - and the four answers, Set A only, Set B only, both and neither, come up equally often because the two sets are drawn from a balanced pairing rather than at random. Sheets can be customized, turned into flash cards, or assigned for online learning.
Student objectives
- Decide whether the mean describes a set of data well.
- Spot the one value that drags an average away from the rest.
- Compare the shapes of two sets of data.
Everyday practice
- Compare two weeks of scores and say which average is fair.
- Ask what one unusually large value does to an average.
- Describe how spread out a short list of numbers is.