Reading Diagrams Worksheets
This section provides comprehensive worksheets that teach students to read and interpret Venn diagrams through progressively challenging activities. Students practice answering questions from two-circle diagrams, understanding union and intersection concepts, shading specific regions, and creating diagrams from table data to develop essential logical reasoning skills.
Problem Type


About these worksheets
These worksheets teach students to read and work with Venn diagrams. Activities progress from answering basic questions using two-circle Venn diagrams, to understanding union and intersection notation with three-circle diagrams, shading specified regions, and filling in Venn diagrams from table data. These resources build logical reasoning and data organization skills.
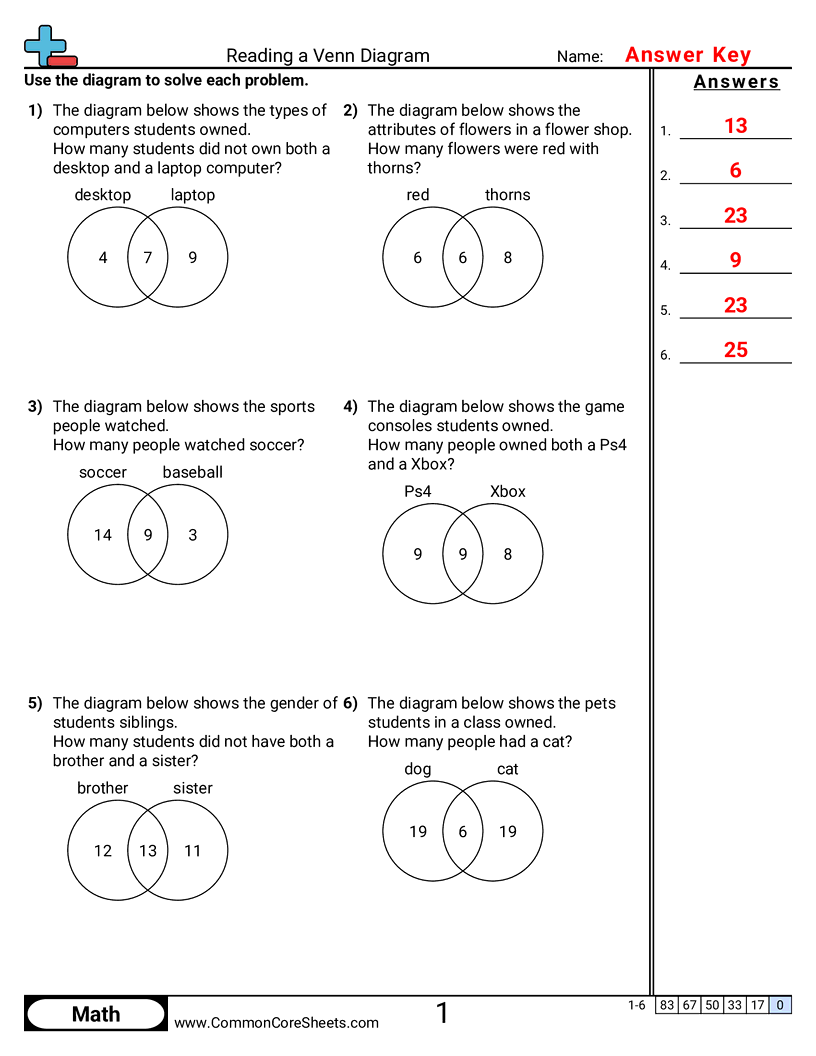


Reading a Venn Diagram
Each worksheet has 6 problems using a venn diagram to answer questions.


Version 1
Version 2
Version 3
Version 4
Version 5
Version 6
Version 7
Version 8
Version 9
Version 10
Grab 'em All
Create New Sheet
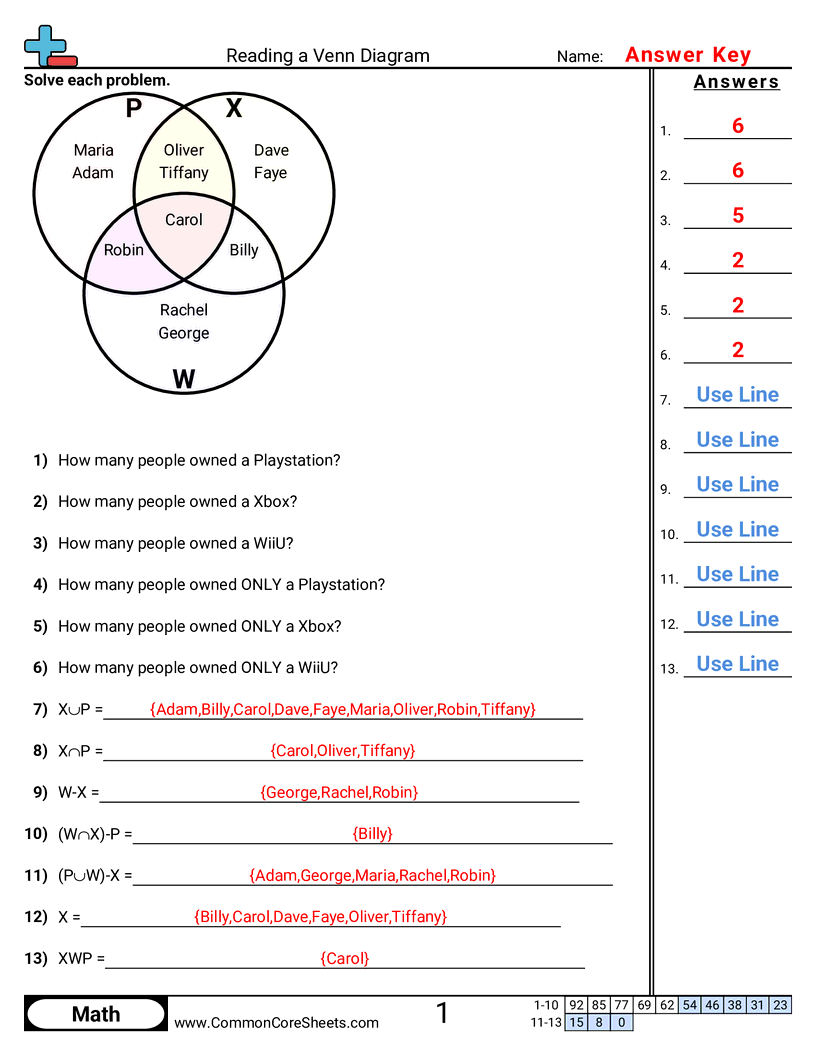
Reading a Venn Diagram
Each worksheet has 13 problems using a venn diagram to answer questions.
Version 1
Version 2
Version 3
Version 4
Version 5
Version 6
Version 7
Version 8
Version 9
Version 10
Grab 'em All
Create New Sheet
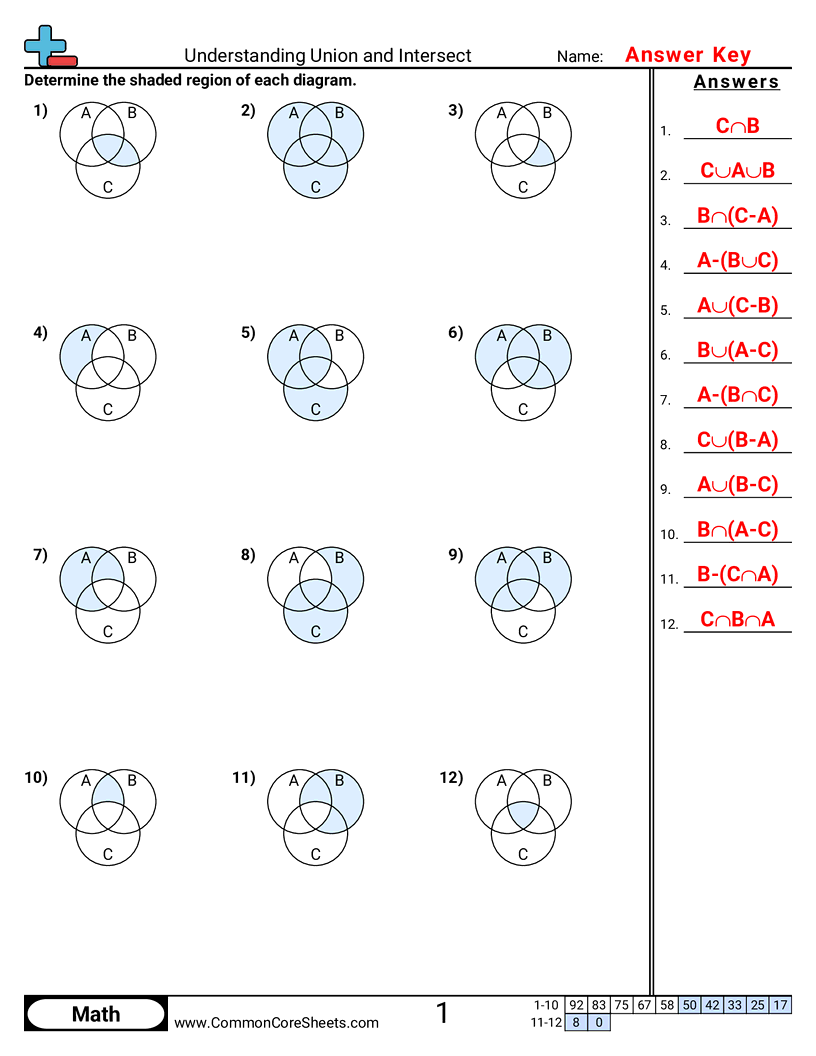
Understanding Union and Intersect
Each worksheet has 12 problems identifying the shaded portion of a Venn Diagram.
Version 1
Version 2
Version 3
Version 4
Version 5
Version 6
Version 7
Version 8
Version 9
Version 10
Grab 'em All
Create New Sheet
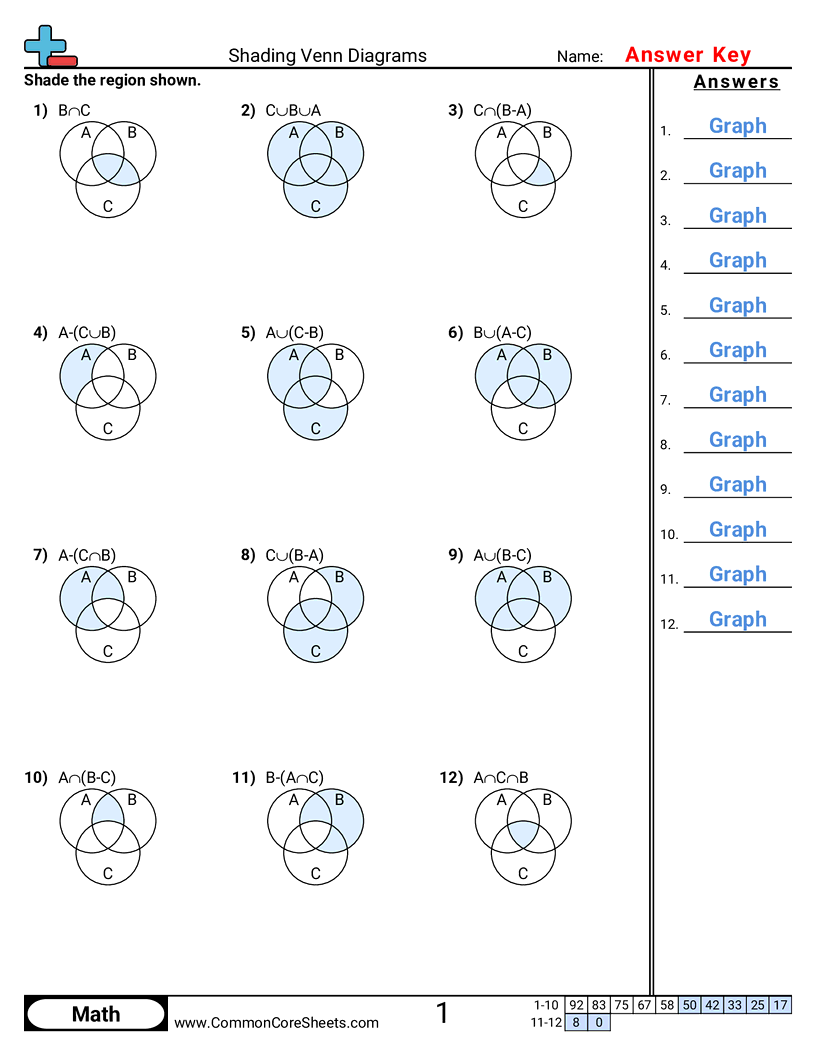
Shading Venn Diagrams
Each worksheet has 12 problems shading a region of a Venn Diagram.
Version 1
Version 2
Version 3
Version 4
Version 5
Version 6
Version 7
Version 8
Version 9
Version 10
Grab 'em All
Create New Sheet
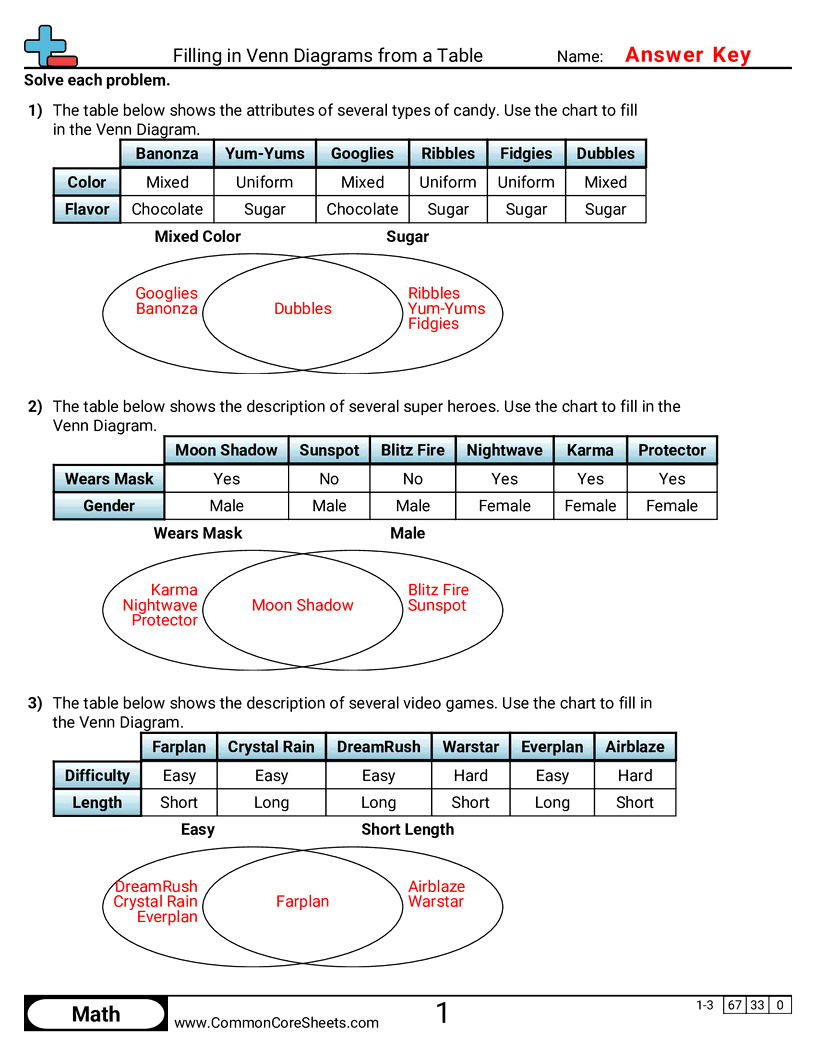
Filling in Venn Diagrams from a Table
Each worksheet has 3 problems filling in a venn diagram from information in a table.
Version 1
Version 2
Version 3
Version 4
Version 5
Version 6
Version 7
Version 8
Version 9
Version 10
Grab 'em All
Create New Sheet
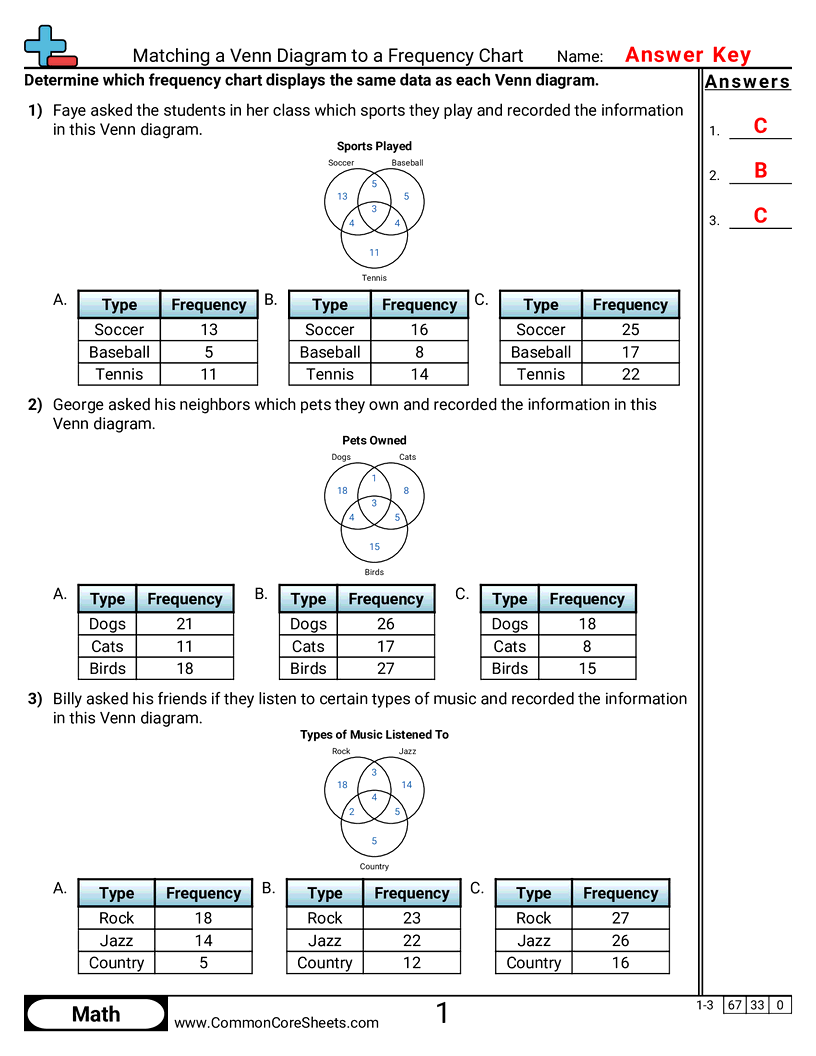
Matching a Venn Diagram to a Frequency Chart
A three-circle Venn diagram holds seven region counts and students choose the frequency chart showing the same data.
Version 1
Version 2
Version 3
Version 4
Version 5
Version 6
Version 7
Version 8
Version 9
Version 10
Grab 'em All
Create New Sheet

Completing a Frequency Chart from a Venn Diagram
A three-circle Venn diagram is shown beside an empty frequency chart and students write in the total for each group.
Version 1
Version 2
Version 3
Version 4
Version 5
Version 6
Version 7
Version 8
Version 9
Version 10
Grab 'em All
Create New Sheet