Completing a Frequency Chart from a Venn Diagram Worksheet Download
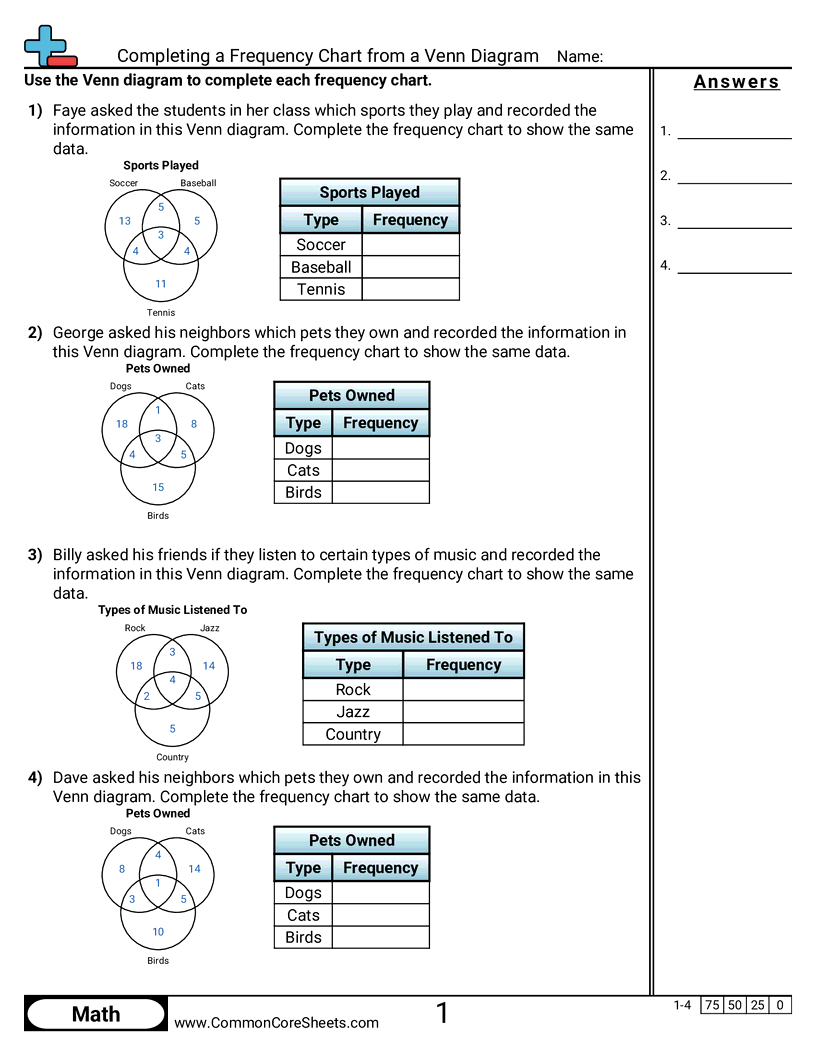
A group's frequency is the sum of ALL FOUR of the regions inside its circle, not the number printed in the middle of it - and with nothing to choose between, that is the whole task. Sheet 1090 asks the same question as multiple choice, where a wrong total can be caught by comparing the four charts; here there is nothing on the page to check an answer against. The word problem runs across the top with the diagram on the left and the chart to be filled on the right.
Select a Different Activity
>


Sheet Information >
Completing a Frequency Chart from a Venn Diagram
A three-circle Venn diagram is shown beside an empty frequency chart and students write in the total for each group.