Matching a Venn Diagram to a Frequency Chart Worksheet Download
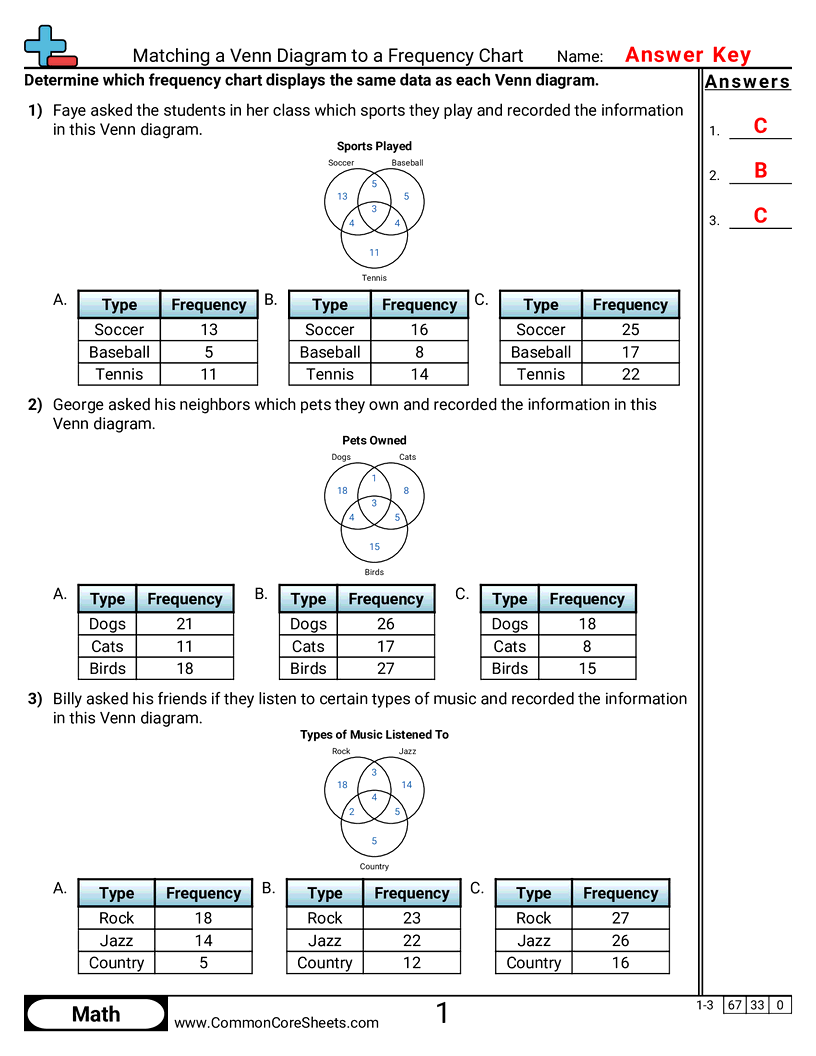
Getting a circle's frequency means adding ALL FOUR of its regions, not reading the number printed inside it. The three wrong charts are the three ways that addition goes wrong, and each one is a number really on the diagram - the circle's own region alone, its own region plus the middle, and the true total with the middle left out. Sheets 995, 997 and 998 read a two-circle Venn and answer a question about it; nothing else on the site turns a Venn diagram into a table.


Sheet Information >
Matching a Venn Diagram to a Frequency Chart
A three-circle Venn diagram holds seven region counts and students choose the frequency chart showing the same data.
About this worksheet
A three-circle Venn diagram holds seven region counts and students choose the frequency chart showing the same data.
Student objectives
- Add every region of a circle to find its total
- Understand that overlapping regions belong to more than one group
- Match a Venn diagram to a frequency chart
- Organize data from a diagram into a table
Everyday practice
- Count how many people like a sport when some like more than one
- Work out a club total when members belong to several clubs
- Read a survey where answers can overlap
- Turn a diagram of overlapping groups into a simple list of totals