Combining Two Tables into a Line Plot
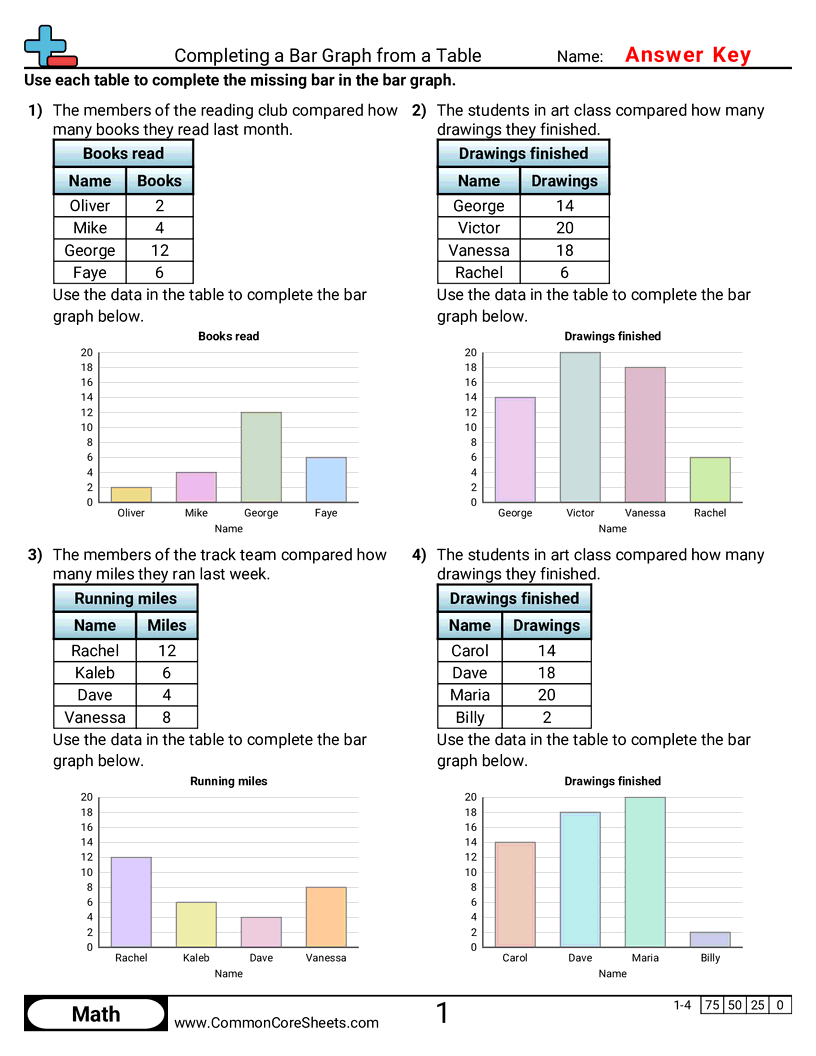
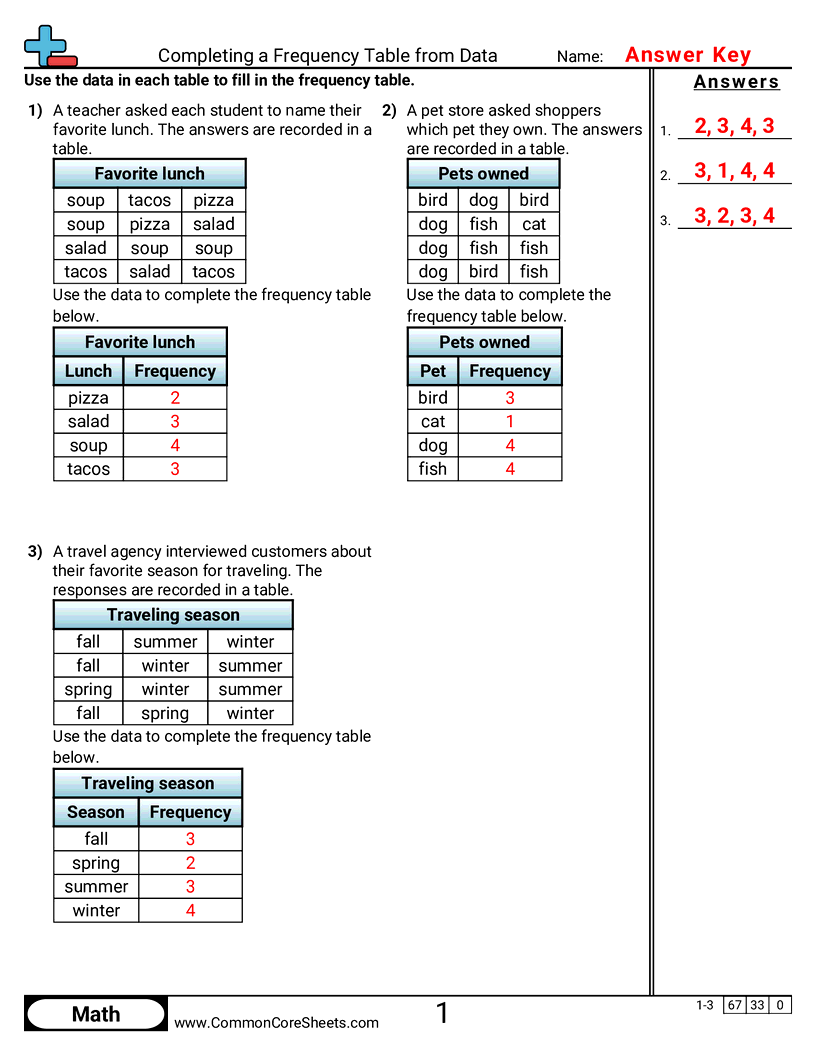
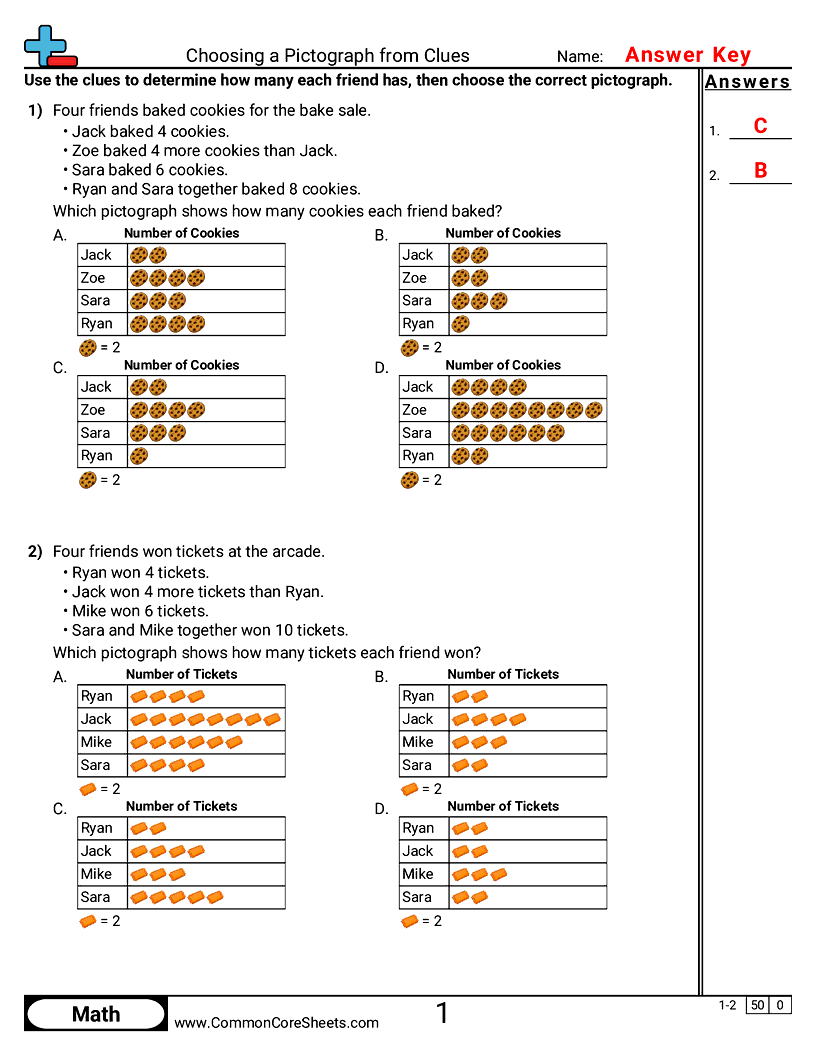
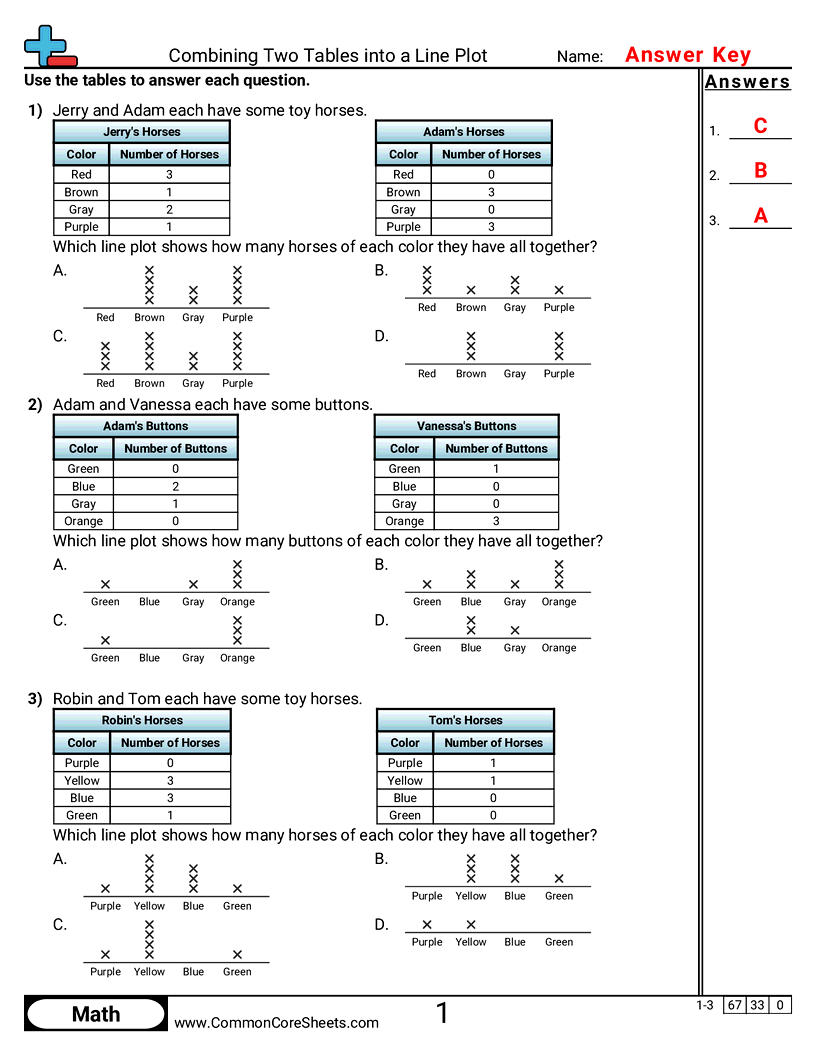
Two people each have their own frequency table and students choose the line plot that shows the combined totals.


Student Objectives
- Add two frequency tables together category by category
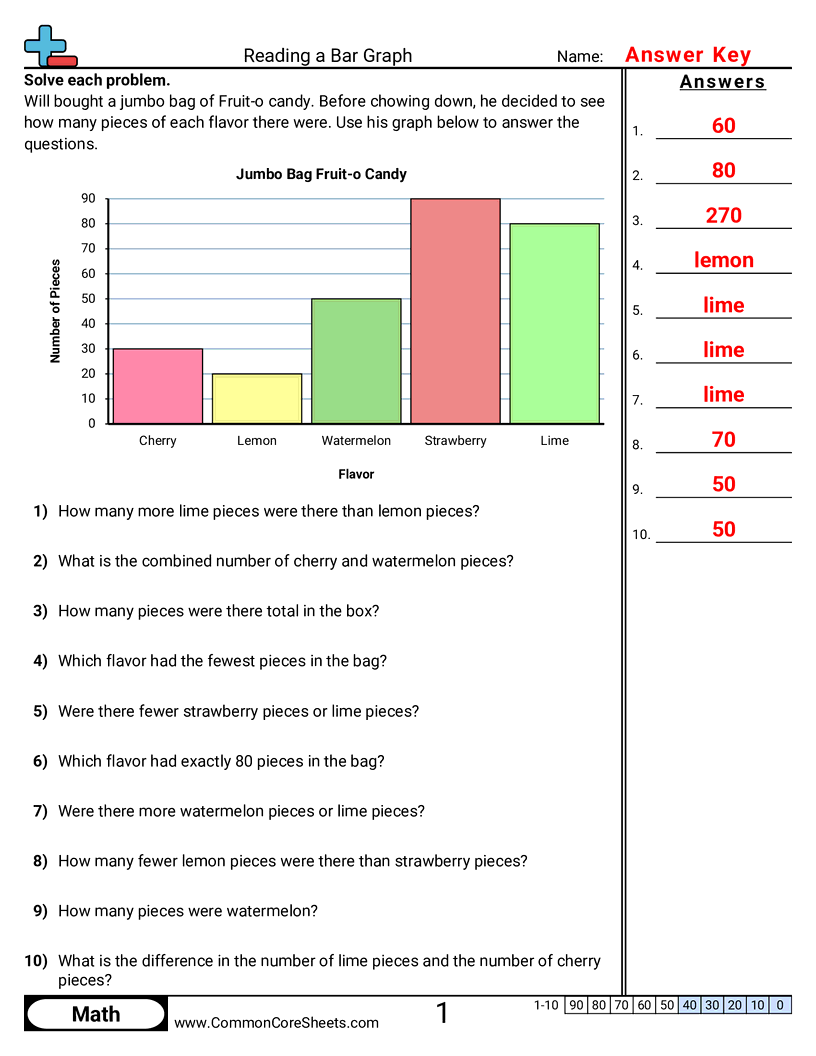
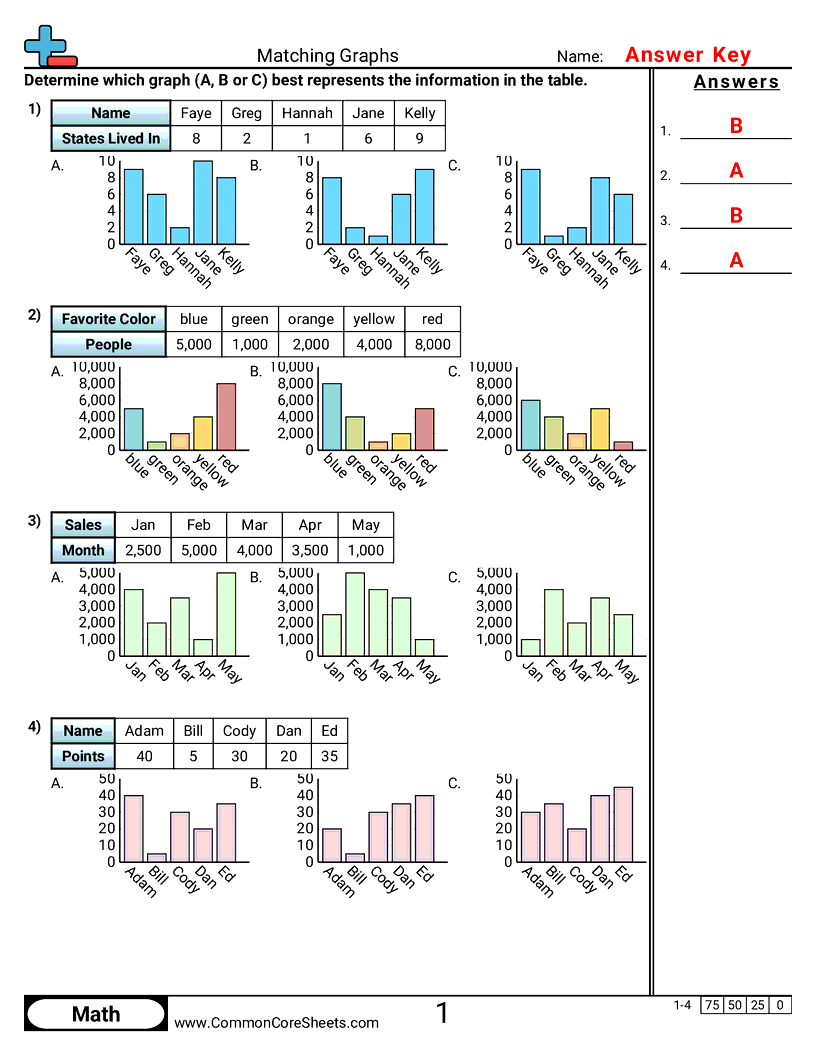
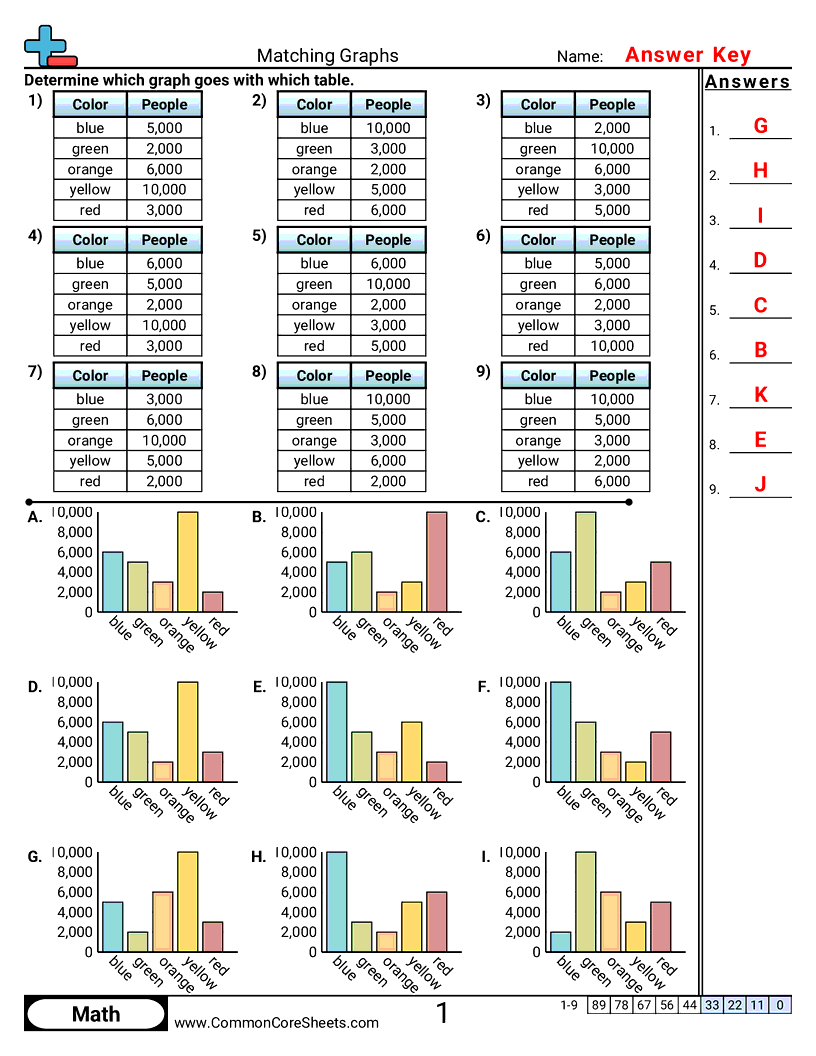
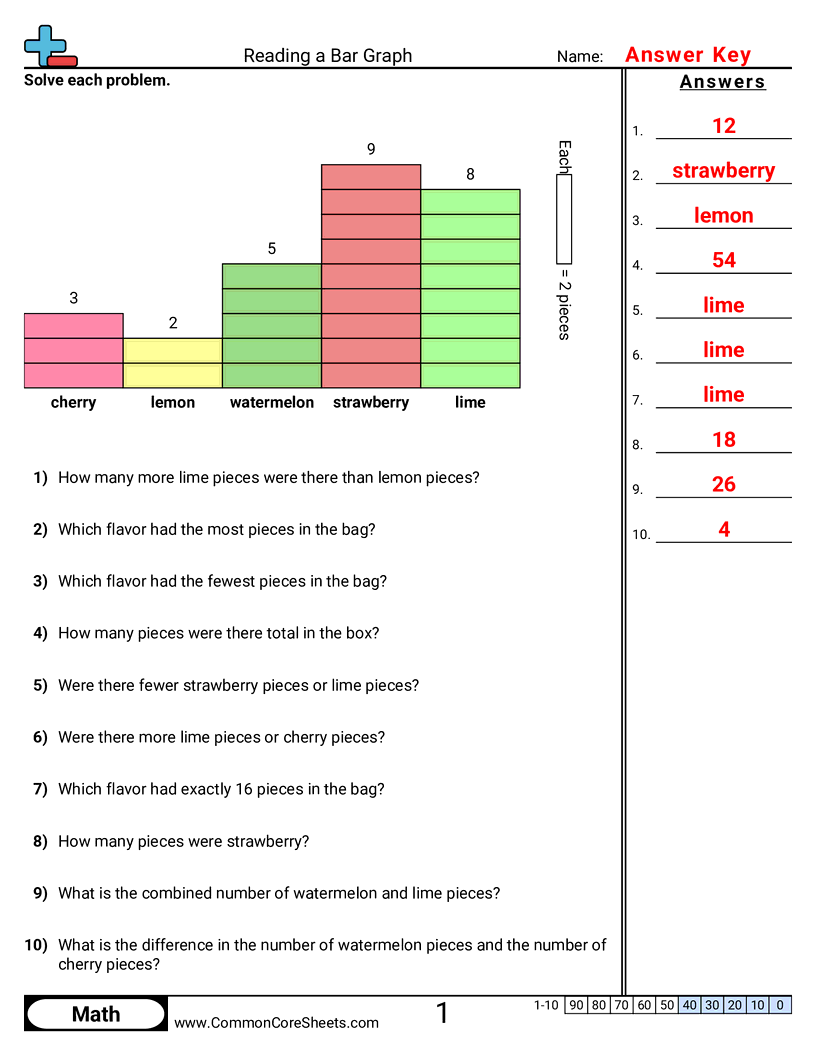
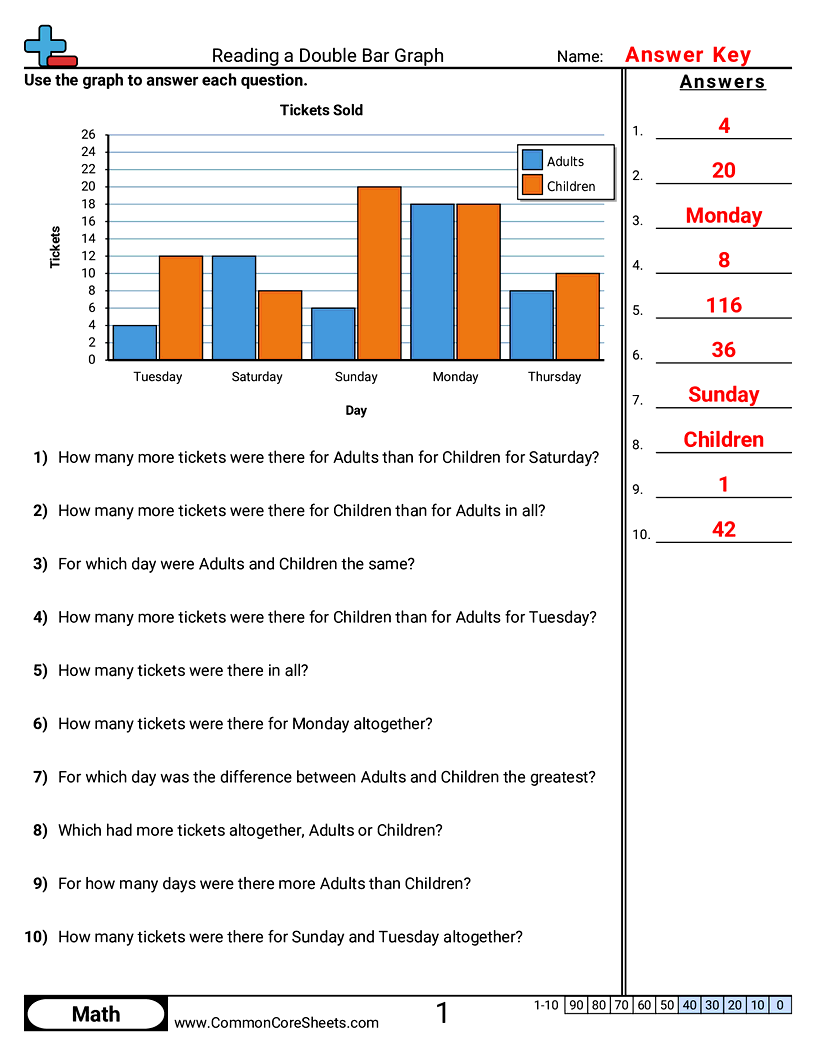
- Read a line plot and match it to a set of counts
- Recognize when a plot shows only part of the data
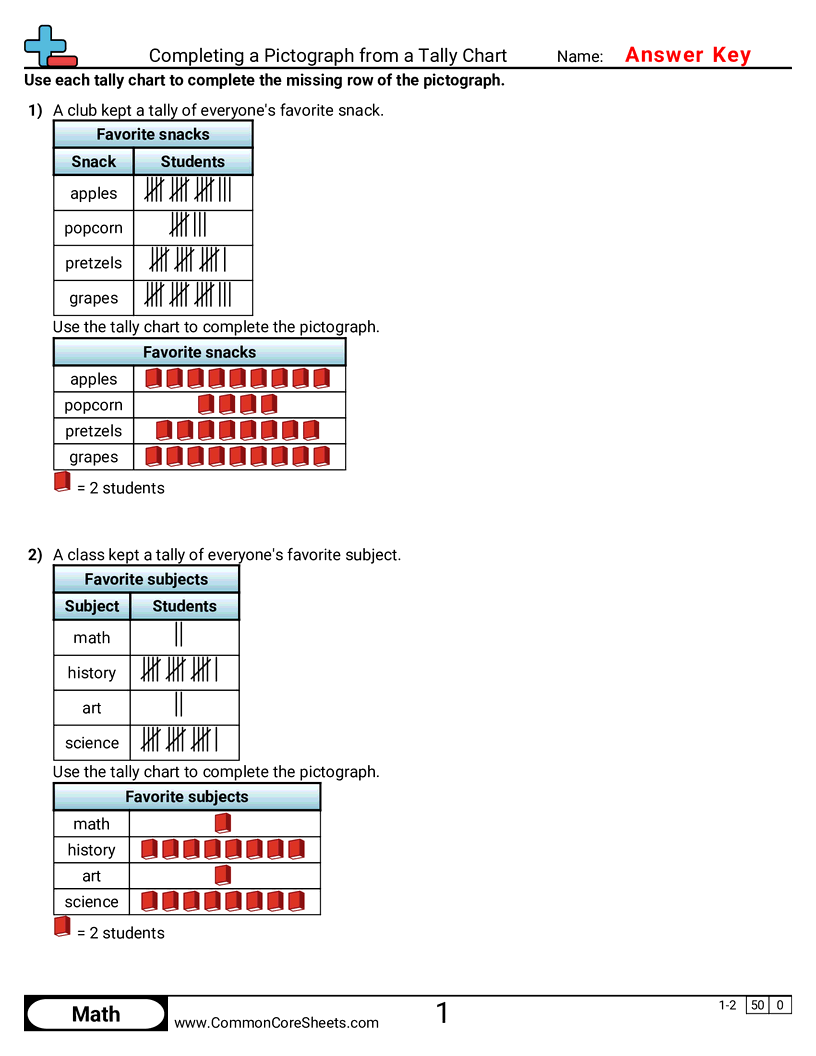
- Organize categorical data onto a line plot
Standards