Combining Two Tables into a Line Plot Worksheet Download
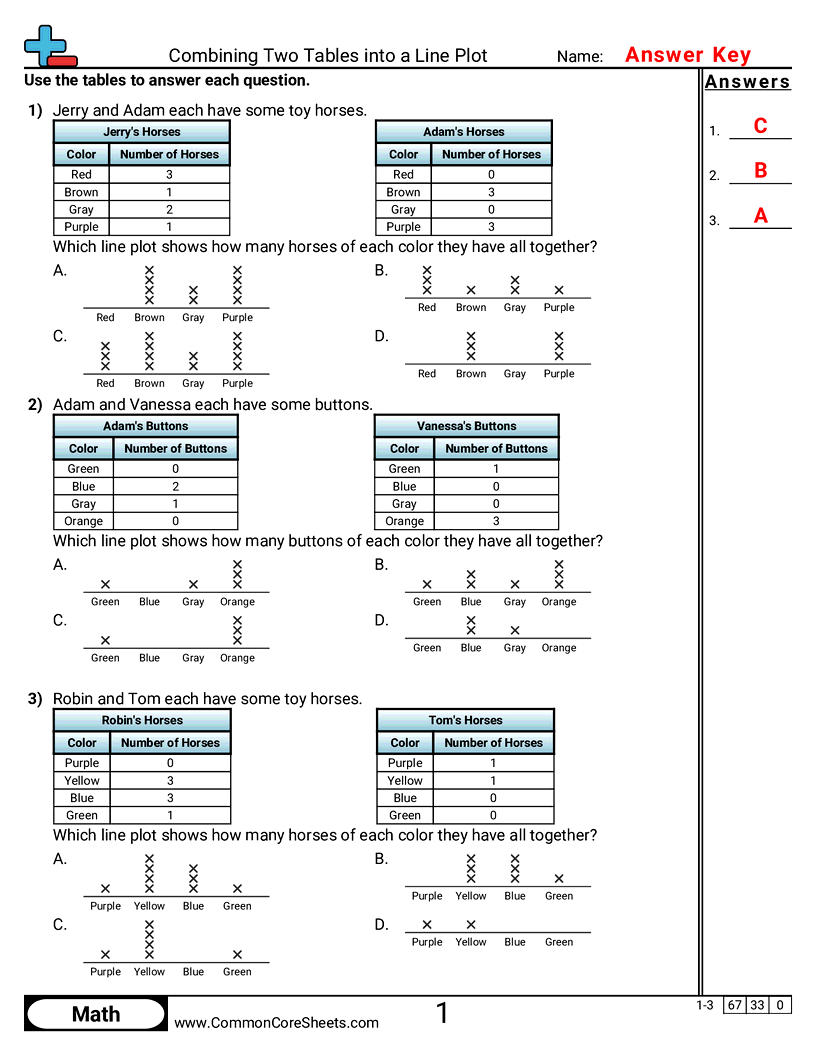
Sheet 1064 transfers one already-tabulated frequency onto a plot; the work here is the combining, so the wrong plots are the ways that goes wrong - one person's table read on its own (both versions are offered) and the totals with a single color taken from only one of the two tables. Every wrong plot is a plot the data really supports, just not of the question asked, so none of them can be dismissed as obviously malformed.


Sheet Information >
Combining Two Tables into a Line Plot
Two people each have their own frequency table and students choose the line plot that shows the combined totals.
About this worksheet
Two people each have their own frequency table and students choose the line plot that shows the combined totals.
Student objectives
- Add two frequency tables together category by category
- Read a line plot and match it to a set of counts
- Recognize when a plot shows only part of the data
- Organize categorical data onto a line plot
Everyday practice
- Add up two lists of the same colors of blocks to see how many there are in all
- Combine two classes' lunch counts to find the totals
- Put together what two people collected and chart the result
- Check a chart against the lists it came from