Combining Two Tables into a Line Plot Worksheet Download
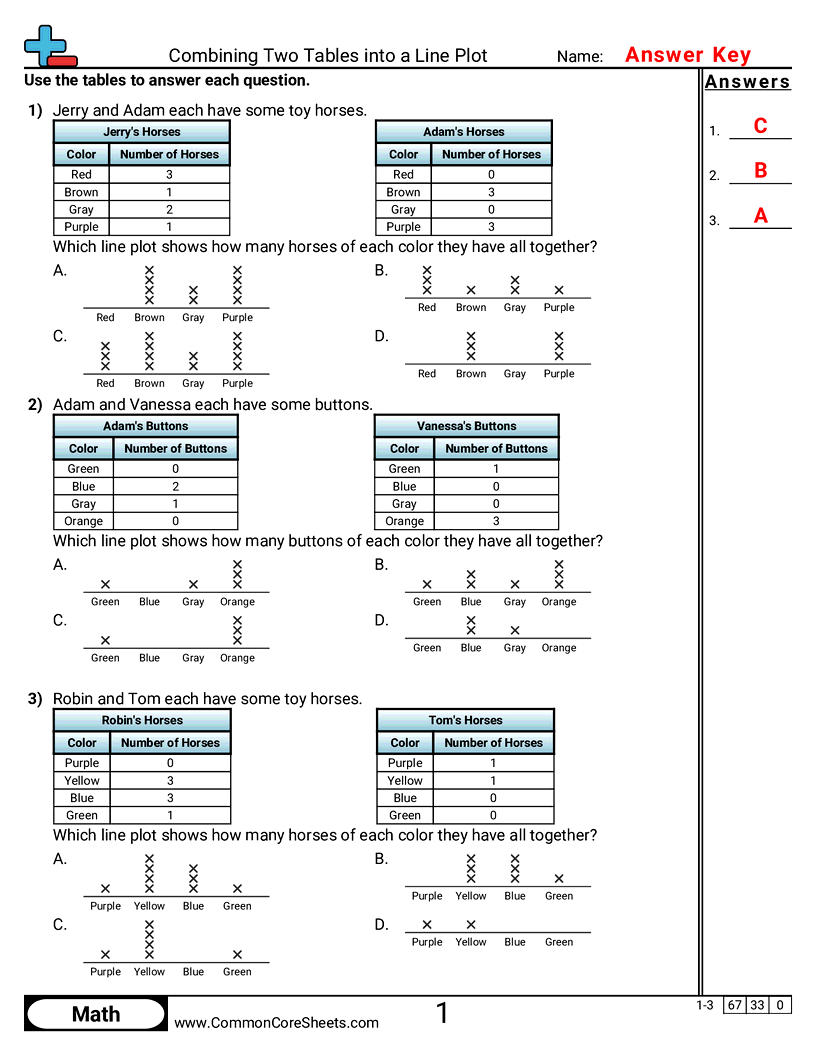
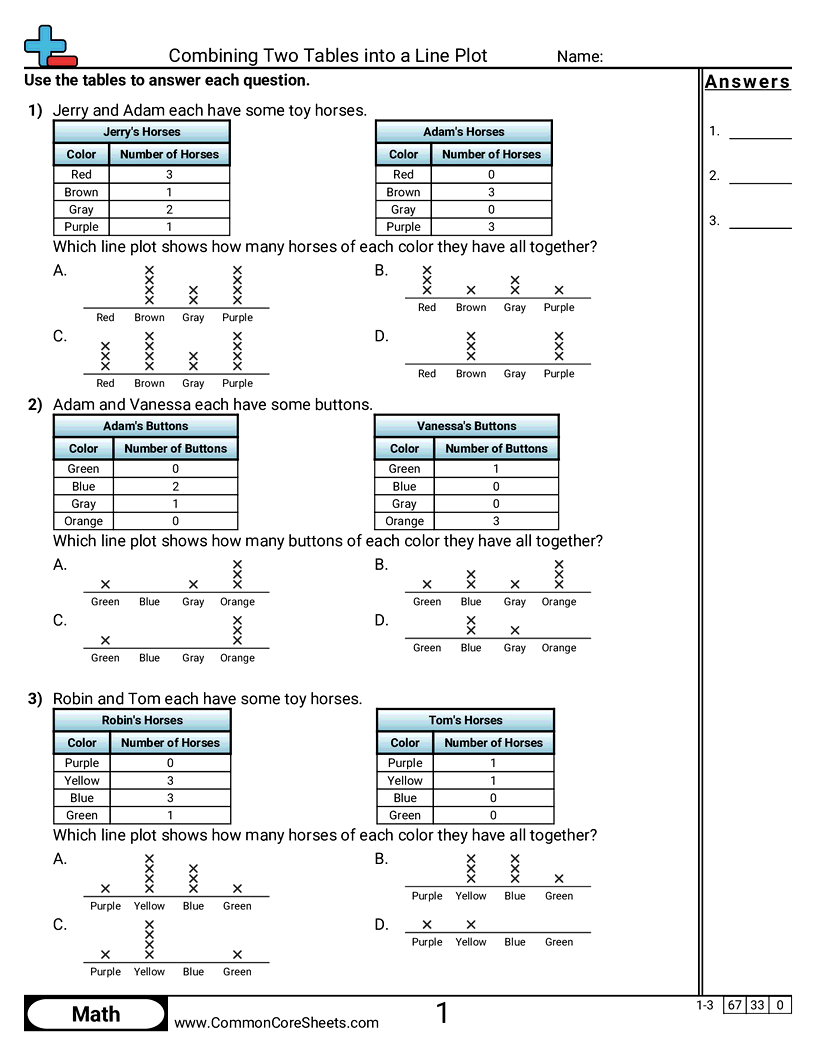
Sheet 1064 transfers one already-tabulated frequency onto a plot; the work here is the combining, so the wrong plots are the ways that goes wrong - one person's table read on its own (both versions are offered) and the totals with a single color taken from only one of the two tables. Every wrong plot is a plot the data really supports, just not of the question asked, so none of them can be dismissed as obviously malformed.
Select a Different Activity
>


Sheet Information >
Combining Two Tables into a Line Plot
Two people each have their own frequency table and students choose the line plot that shows the combined totals.