Creating a Bar Graph with Fractions and Decimals
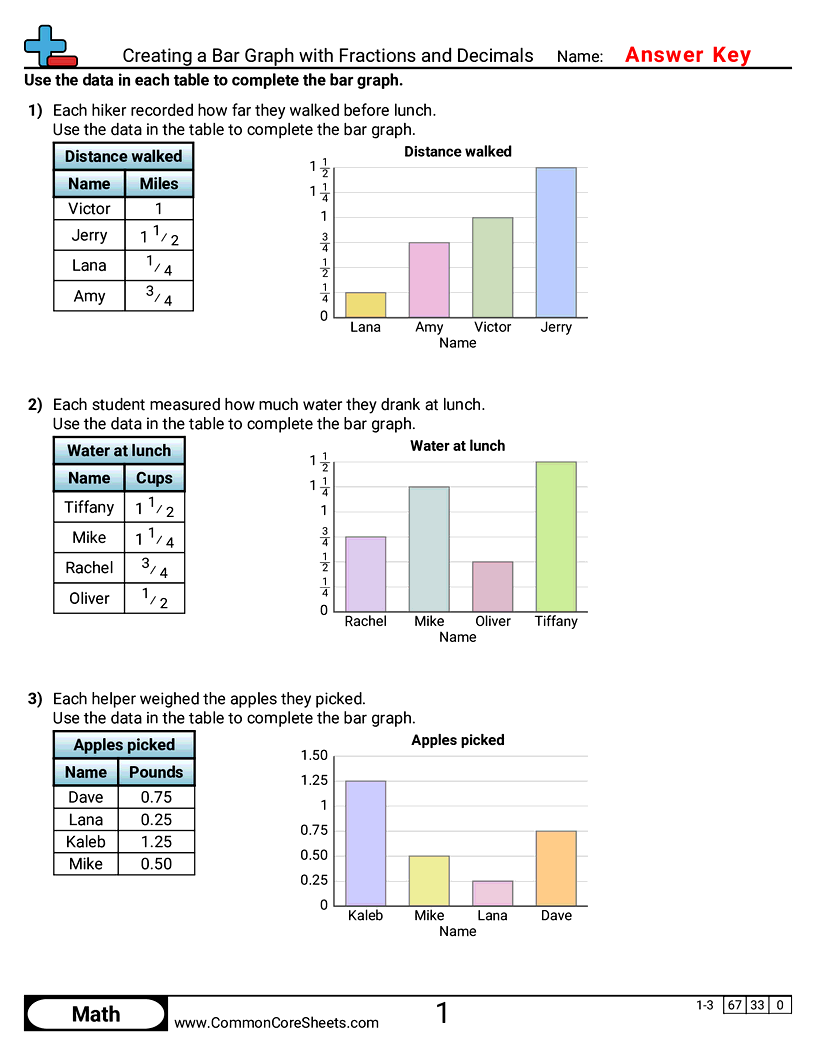
Each worksheet has 3 problems drawing bars for values written as benchmark fractions or decimals.


Student Objectives
- Draw bars for values given as benchmark fractions or decimals.
- Read a scale marked in fourths.
- Recognize that 0.50 and one half mark the same place.
Tags