Creating a Bar Graph with Fractions and Decimals Worksheet Download
Free 4th Grade math worksheets on Creating a Bar Graph with Fractions and Decimals. Each worksheet has 3 problems with an answer key and are ideal for teachers and homeschooling. You can download the PDF, create a set of flash cards or set it up for online learning.


Sheet Information >
About this worksheet
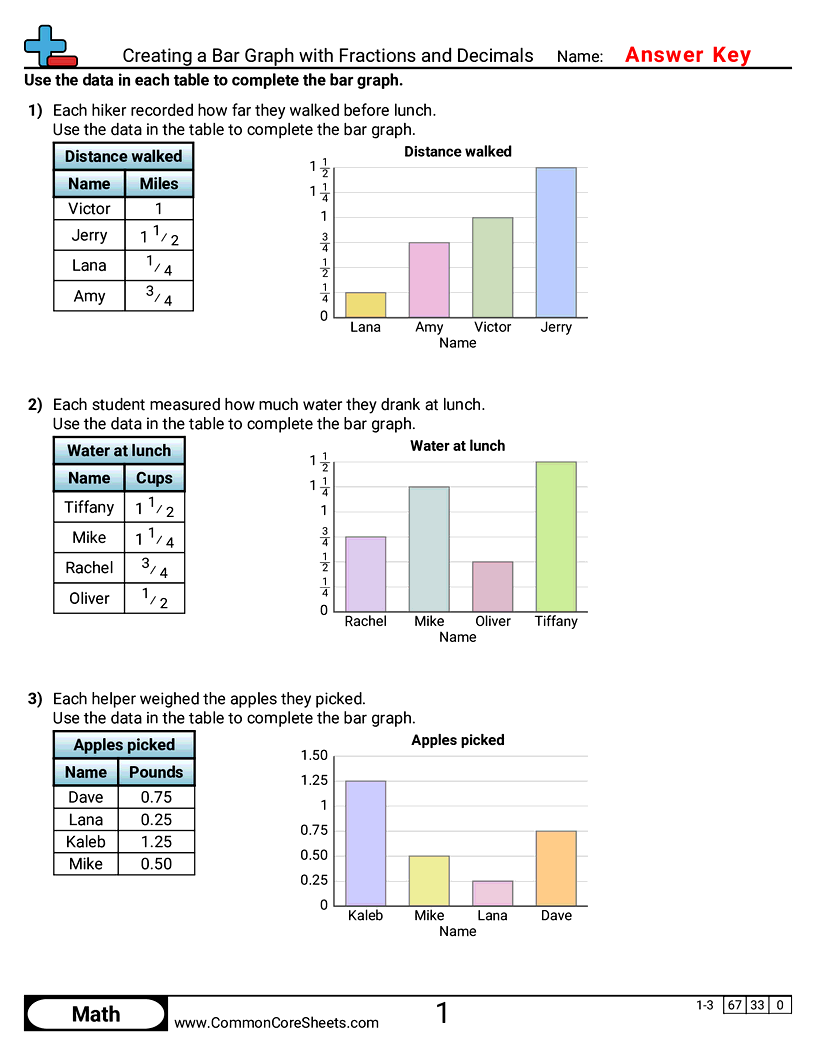
Each worksheet has 3 problems drawing bars for values written as benchmark fractions or decimals.
This worksheet asks the student to build a bar graph from values written as benchmark fractions or decimals - a quarter, a half, three quarters - against a scale marked in fourths. Fractions and decimals alternate problem by problem rather than mixing inside one graph, so each scale stays readable while both forms named in the standard get practiced. Sheets can be customized, turned into flash cards, or assigned for online learning.
Student objectives
- Draw bars for values given as benchmark fractions or decimals.
- Read a scale marked in fourths.
- Recognize that 0.50 and one half mark the same place.
Everyday practice
- Measure something in half or quarter units and graph it.
- Say where 0.75 sits between 0 and 1.
- Find a scale that counts by quarters.