Interpreting Histograms
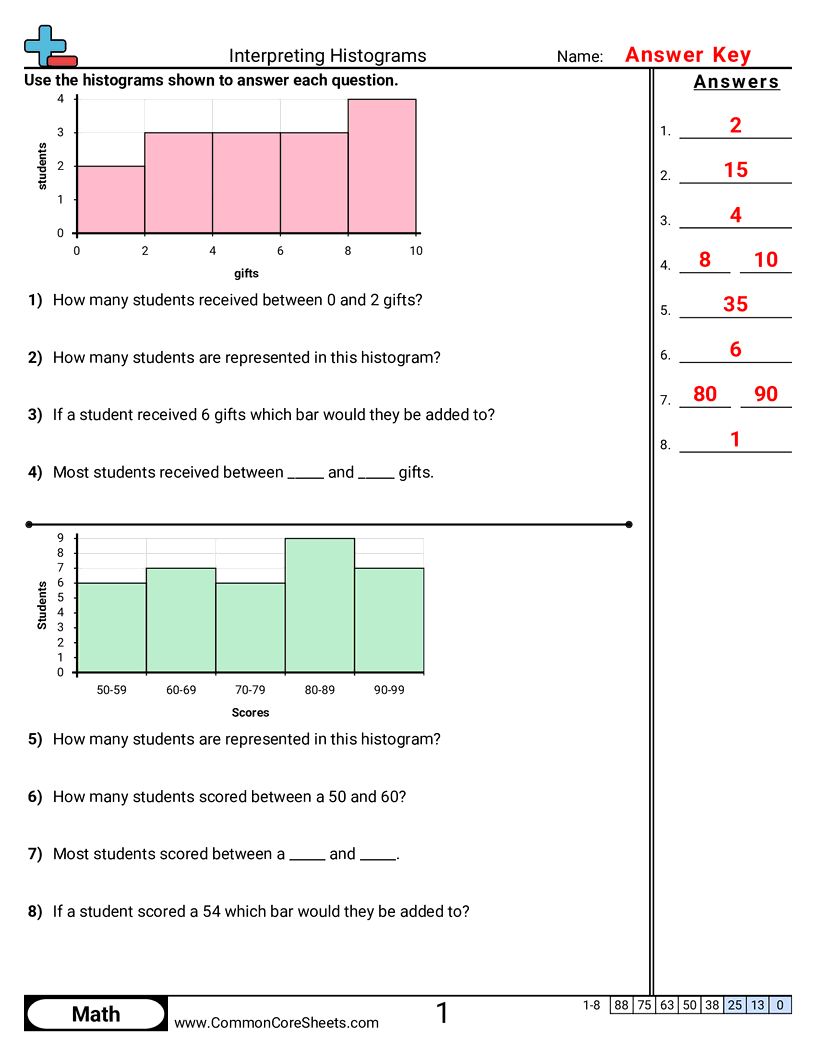
Each worksheet has 8 problems using a histogram to answer questions.


Student Objectives
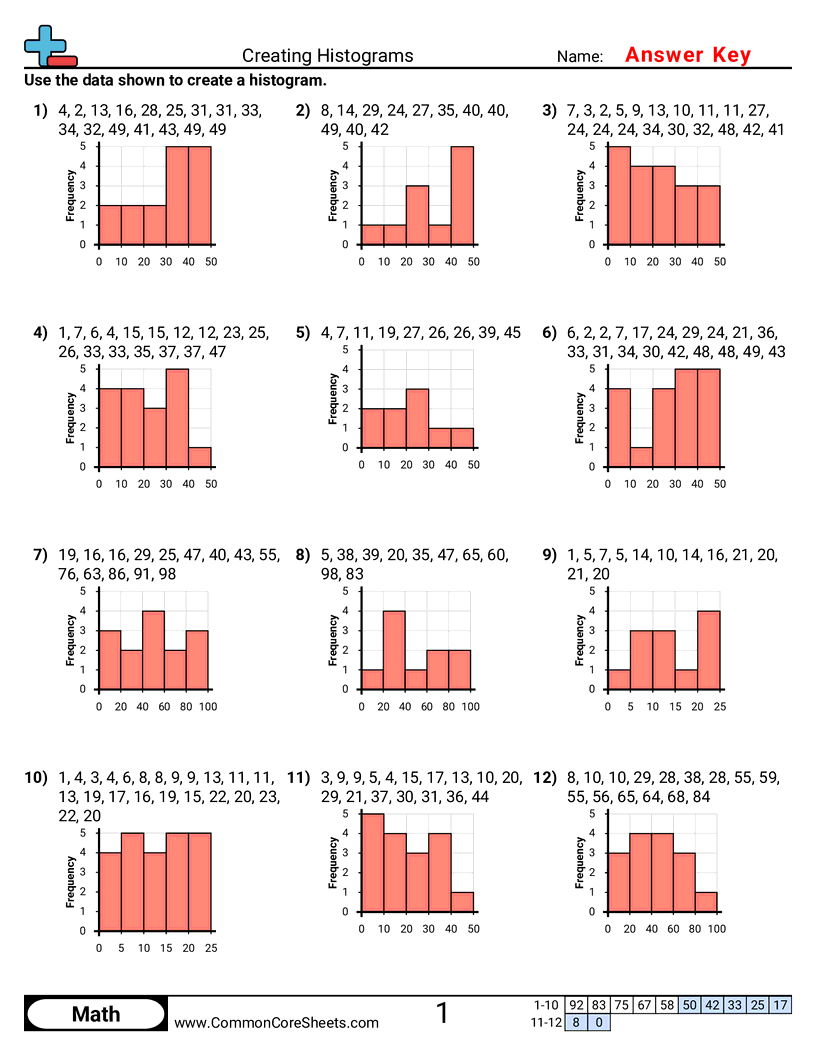
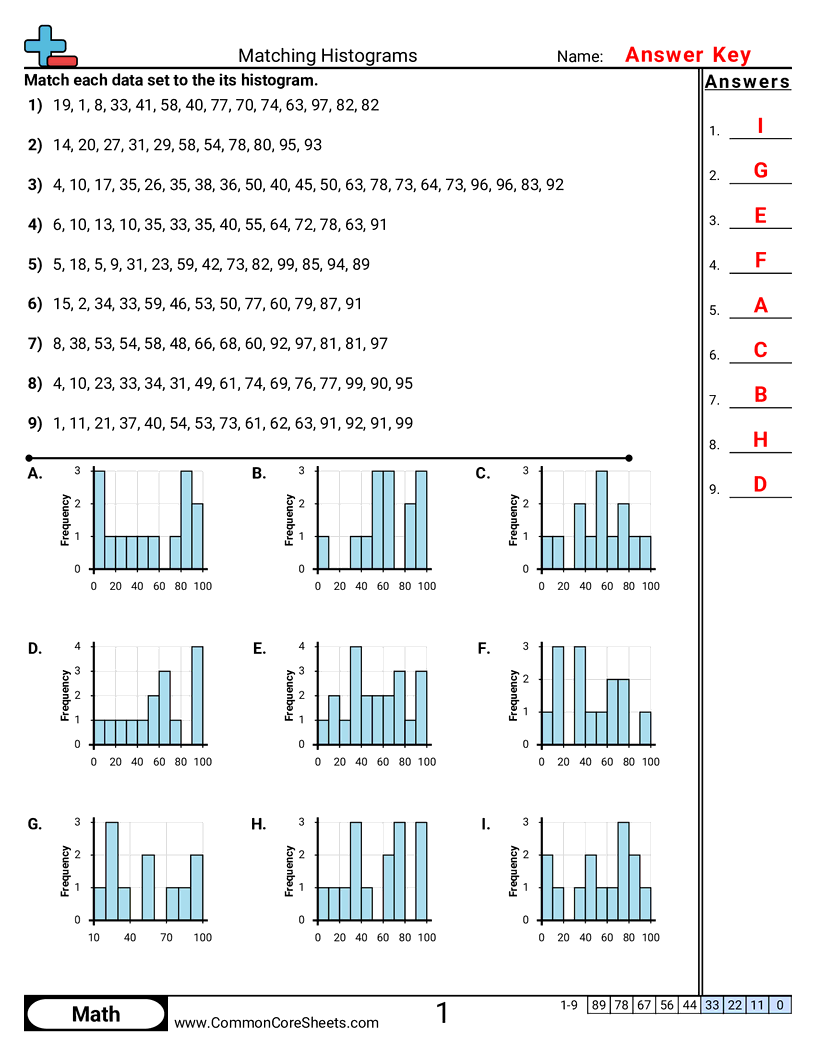
- Read a histogram and explain what the bars and labels mean.
- Find how many data points fall in a given interval (bin).
- Identify which interval has the most or least data.
- Compare two intervals to see where values are more common.
Tags
Standards