Completing a Frequency Table from Data Worksheet Download
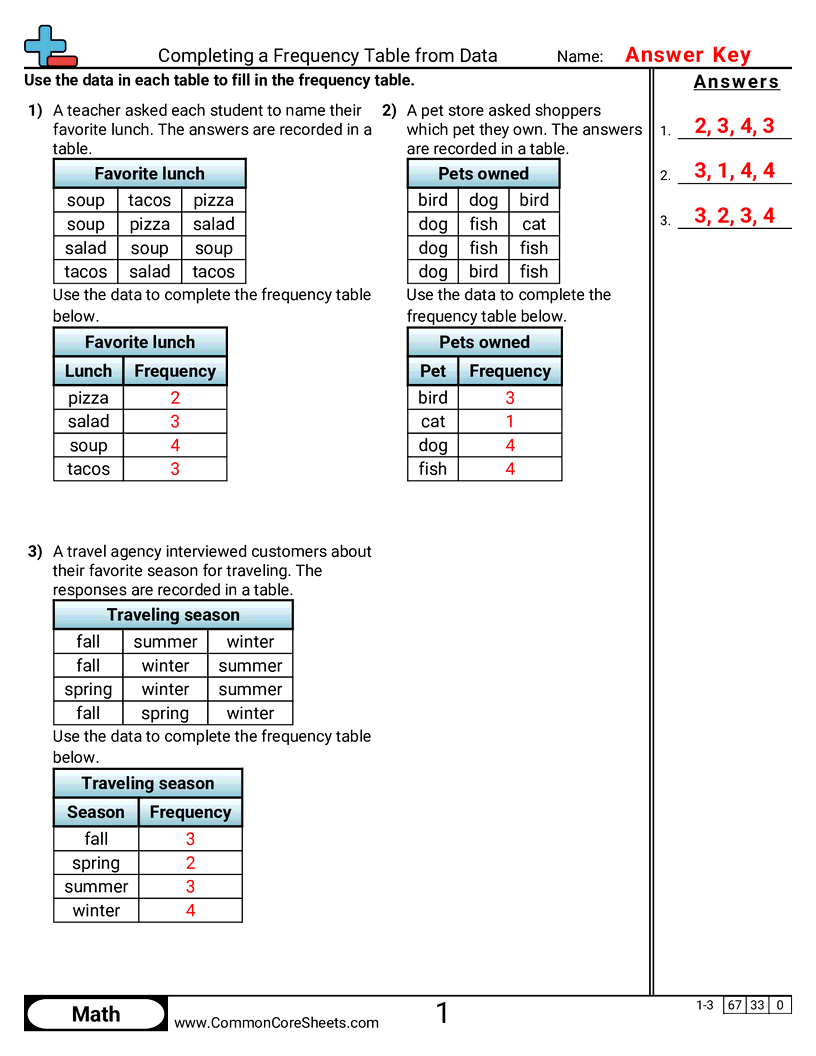
This worksheet shows a grid of unsorted survey responses and asks the student to fill in a frequency table beneath it. The counting is the work - the responses are scattered through the grid rather than grouped, and the frequency table lists the categories alphabetically so their order gives nothing away. Every category appears at least once, so a blank row always means something was missed. This differs from the tally-mark sheets, where the count has already been made.


Sheet Information >
Completing a Frequency Table from Data
Students count how many times each answer appears in a set of raw responses and record the totals in a frequency table.
About this worksheet
Students count how many times each answer appears in a set of raw responses and record the totals in a frequency table.
Student objectives
- Count how many times each item appears in a set of data
- Fill in missing numbers on a frequency table
- Organize a group of items by category
- Read and use tally marks or counts to record totals
Everyday practice
- Count how many of each color candy are in a bag and write down the totals
- Keep track of how many pets your friends have by category
- Tally the number of cars, trucks, and vans that pass by your window
- Sort a bin of toys and record how many of each type you have