Reading a Bar Graph: 5 Bars - Single Unit Worksheet Download
Free 3rd Grade (3md3) math worksheets on Reading a Bar Graph . Each worksheet has 10 problems with an answer key and are ideal for teachers and homeschooling. You can download the PDF, create a set of flash cards or set it up for online learning.


Sheet Information >
About this worksheet
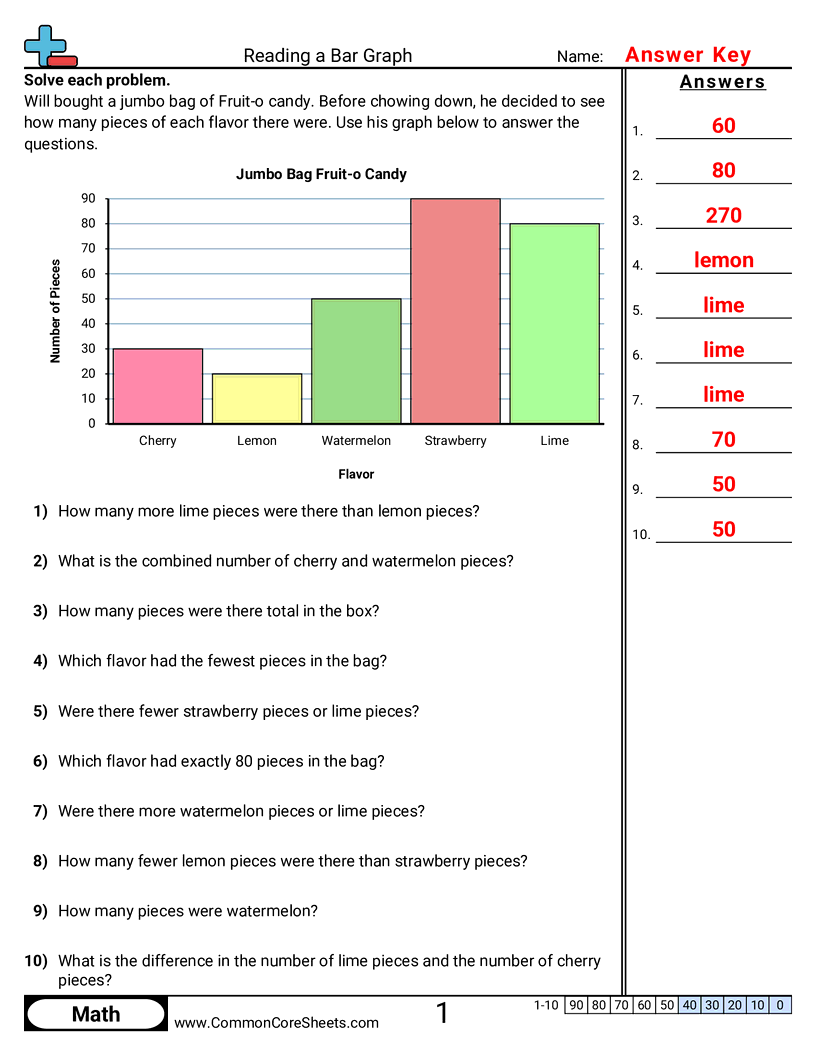
Each worksheet has 10 questions answering questions based on a bar graph.
This worksheet is designed to enhance children's understanding of bar graphs in math. It features 10 engaging problems where youngsters interpret data, compare figures, and analyze subject popularity based on student votes. Versatile and adaptable, it suits various learning approaches. Customize per your needs, convert into flashcards for hands-on learning, or integrate into any distance learning curriculum for a fruitful educational experience.
Student objectives
- Read a bar graph with five categories and tell how many are in each category.
- Answer questions that compare two categories, like which has more or how many more.
- Find the total number of items shown by adding the values from all the bars.
Everyday practice
- Look at a class survey chart (favorite fruit, pets, or sports) and compare which choice got more votes.
- Read a simple chart in a kids’ magazine or website poll and figure out the total number of responses.
- Check a weekly chore chart that uses bars to show how many chores each person finished and see who did more.
- Compare a team’s points by quarter on a simple bar chart to see which quarter had the most points.