Matching a Venn Diagram to a Frequency Chart
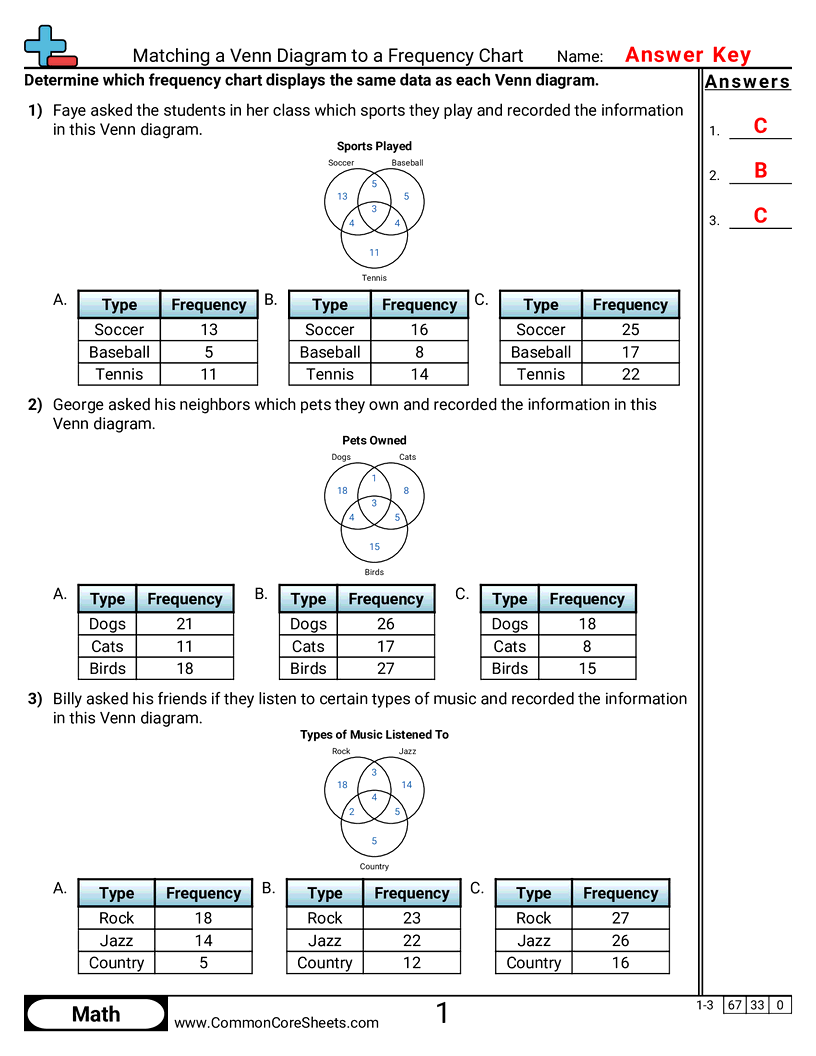
A three-circle Venn diagram holds seven region counts and students choose the frequency chart showing the same data.


Student Objectives
- Add every region of a circle to find its total
- Understand that overlapping regions belong to more than one group
- Match a Venn diagram to a frequency chart
- Organize data from a diagram into a table