Interpreting Histograms Worksheet Download
Free math worksheets on Interpreting Histograms. Each worksheet has 8 problems with an answer key and are ideal for teachers and homeschooling. You can download the PDF, create a set of flash cards or set it up for online learning.
Select a Different Activity
>


Sheet Information >
Interpreting Histograms
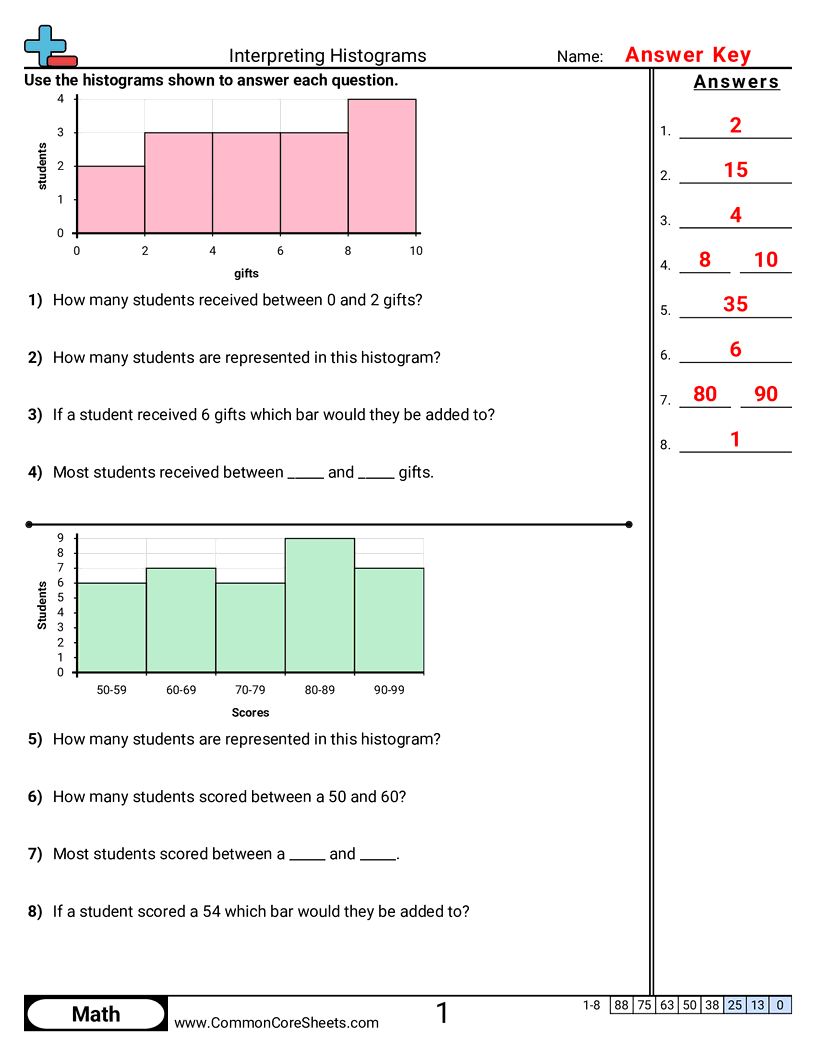
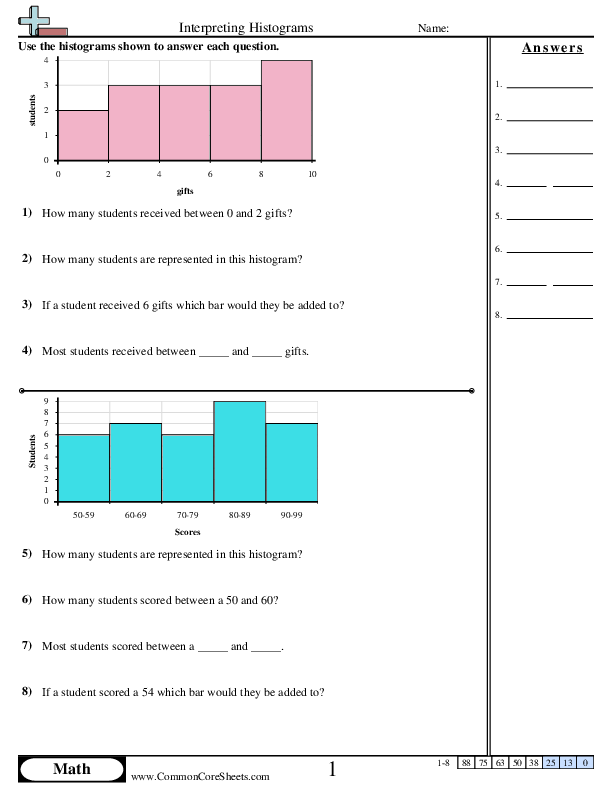
Each worksheet has 8 problems using a histogram to answer questions.
About this worksheet
Each worksheet has 8 problems using a histogram to answer questions.
This worksheet is designed to enhance children's understanding of interpreting histograms in math, sharpening their skillset with 8 interactive problems. It aids in visualizing data distribution and comprehending class scores. Its flexible design allows customization to fit each student's needs and can easily be converted into flashcards or utilized in distance learning settings, making math learning fun and accessible anywhere.
Student objectives
- Read a histogram and explain what the bars and labels mean.
- Find how many data points fall in a given interval (bin).
- Identify which interval has the most or least data.
- Compare two intervals to see where values are more common.
Everyday practice
- Look at a histogram of class test scores to see what score range most students got.
- Check a histogram of daily temperatures for a month to see which temperature range happened most often.
- Use a histogram of video game session lengths to see the most common time range you play.
- Read a histogram of library book checkout times to see how long people usually keep books.
Standards
Tags
short sentencevisualgraphing