Identifying Rate of Change (Graphs) Worksheet Download
Free 8th Grade (8f2) math worksheets on Identifying Rate of Change (Graphs). Each worksheet has 6 problems with an answer key and are ideal for teachers and homeschooling. You can download the PDF, create a set of flash cards or set it up for online learning.
Select a Different Activity
>


Sheet Information >
About this worksheet
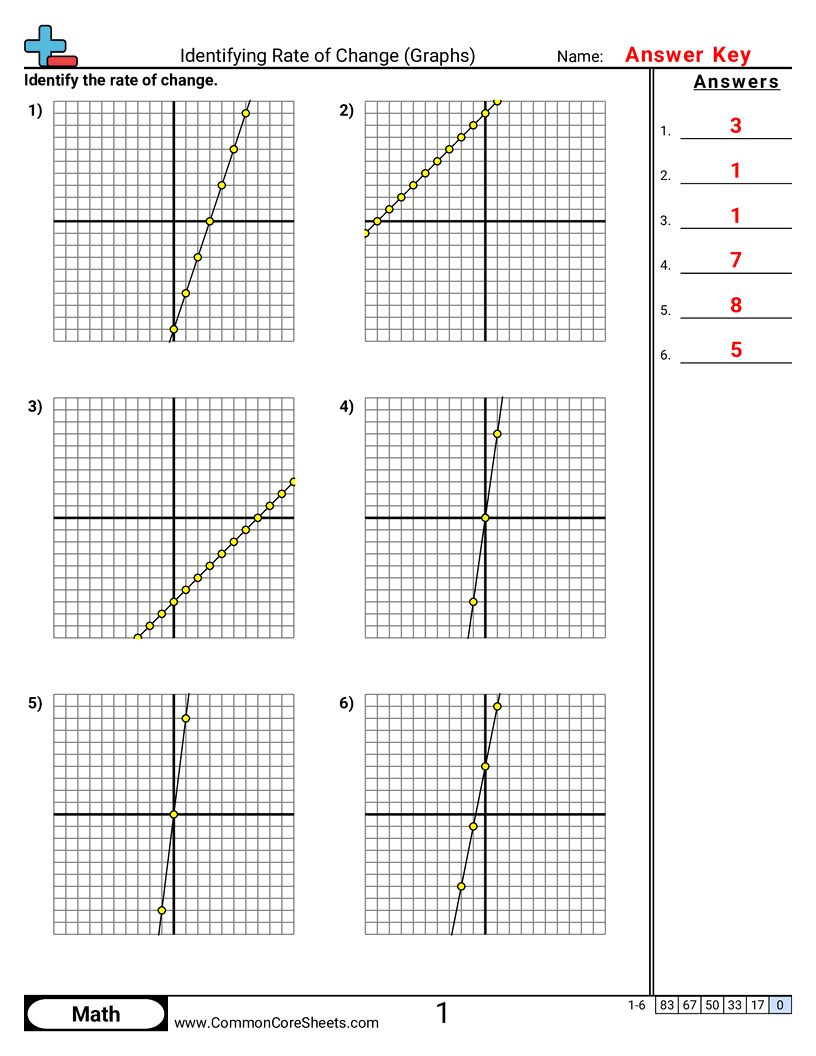
Each worksheet has 6 problems identifying the rate of change using information on a graph.
This worksheet is designed to help children understand the concept of 'Rate of Change' in graphs through six mathematical problems. It facilitates the learning of mathematical dependence and the identification of slope or rate from graphs. This versatile tool can be customized according to unique learning needs, effortlessly converted into flashcards for bite-sized learning, or utilized effectively in distance learning platforms to ensure comprehensive understanding, regardless of dispensation.
Student objectives
- Read points from a graph and use them to find how much y changes when x changes.
- Find the rate of change by counting the rise and run between two points on a line.
- Tell whether a line shows a positive, negative, or zero rate of change.
Everyday practice
- Compare two phone plans on a cost-versus-data graph to see which price increases faster.
- Use a distance-versus-time graph from a run or bike ride to tell your speed.
- Look at a temperature-over-time graph to see how quickly it’s warming up or cooling down.
- Compare two savings-over-time graphs to see which account balance is growing faster.